🔥 I have now analyzed all-cause mortality (acm) from many countries around the world by flu season, and I cannot find any correlation to vaccination!
> Here are the results, starting with 49 countries for which data is available.
1/n 🧵#Covid #Covid #Covid19 #Corona #Vaccine
> Here are the results, starting with 49 countries for which data is available.
1/n 🧵#Covid #Covid #Covid19 #Corona #Vaccine

Same chart with country labels.
> R2=0.0005; p<0.05 stat. sign.
> This means the introduction of vaccination appears to have no significant effect on acm.
> Countries essentially experienced the same level of excess mortality in flu season 21/22 as in 20/21.
> R2=0.0005; p<0.05 stat. sign.
> This means the introduction of vaccination appears to have no significant effect on acm.
> Countries essentially experienced the same level of excess mortality in flu season 21/22 as in 20/21.

Let's look at the US states. Same result.
> R2=0.14, p<0.05 stat. sign.
> Slight increase of acm in the states that have more vaccination.
> R2=0.14, p<0.05 stat. sign.
> Slight increase of acm in the states that have more vaccination.

Let's look at Europe! Here I use data from EuroMOMO which also allows us to compare by age bins:
> Same results here, no significant improvements by season:
> Same results here, no significant improvements by season:

And lastly for Germanys 16 states:
> Similar result here as observed in the US. States that have more vaccination saw more mortality in flu season 21/22 compared to 20/21.
> Similar result here as observed in the US. States that have more vaccination saw more mortality in flu season 21/22 compared to 20/21.

Sources & Calculations:
> docs.google.com/spreadsheets/d…
> docs.google.com/spreadsheets/d…
> docs.google.com/spreadsheets/d…
> docs.google.com/spreadsheets/d…
> docs.google.com/spreadsheets/d…
> docs.google.com/spreadsheets/d…
> docs.google.com/spreadsheets/d…
> docs.google.com/spreadsheets/d…
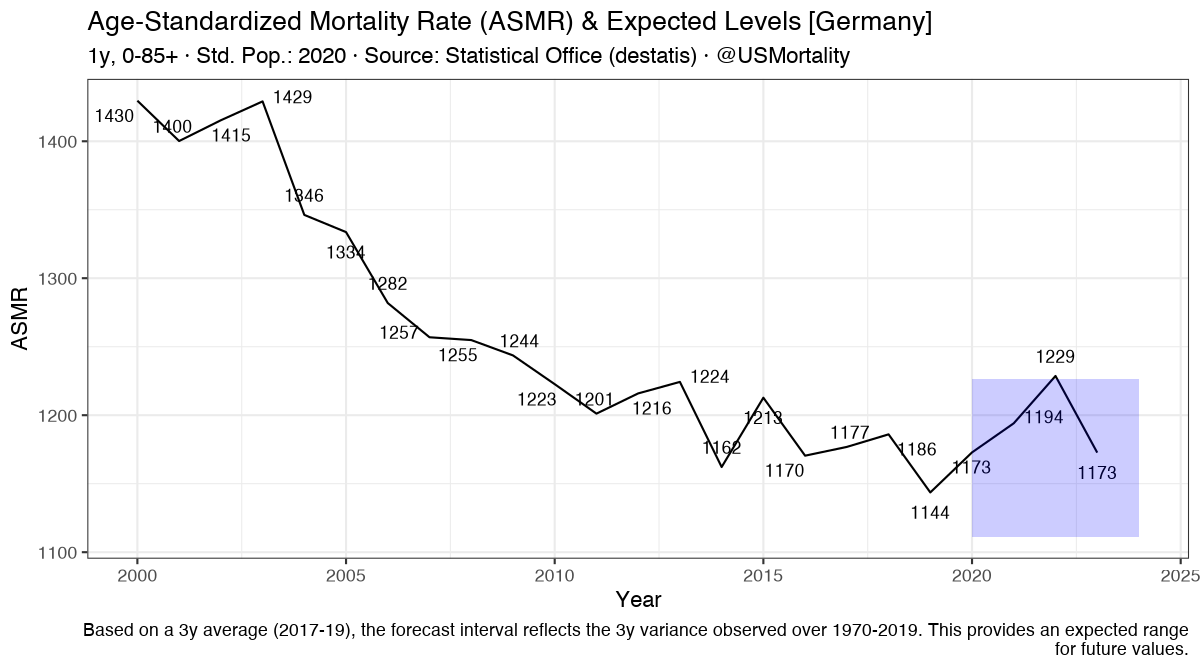
In summary, my conclusion is that the COVID-19 vaccination appears to have no significant effect in changing all-cause mortality.
Countries that have high excess still experience high excess, e.g. USA.
There are other countries that have essentially 0 excess, e.g.Germany, Sweden.
Countries that have high excess still experience high excess, e.g. USA.
There are other countries that have essentially 0 excess, e.g.Germany, Sweden.
• • •
Missing some Tweet in this thread? You can try to
force a refresh