Guess I got a bit side-tracked while creating some (mostly bad) color palette examples for a #datviz training...

1. sequential
2. diverging
3. rainbow
4. qualitative (used for quantitative data) A world map of human popula...A world map of human popula...A world map of human popula...A world map of human popula...
All the colors (so far) 🧡🤎💙💚❤️💜💛 screenshot of my collection...
A bit of additional information:

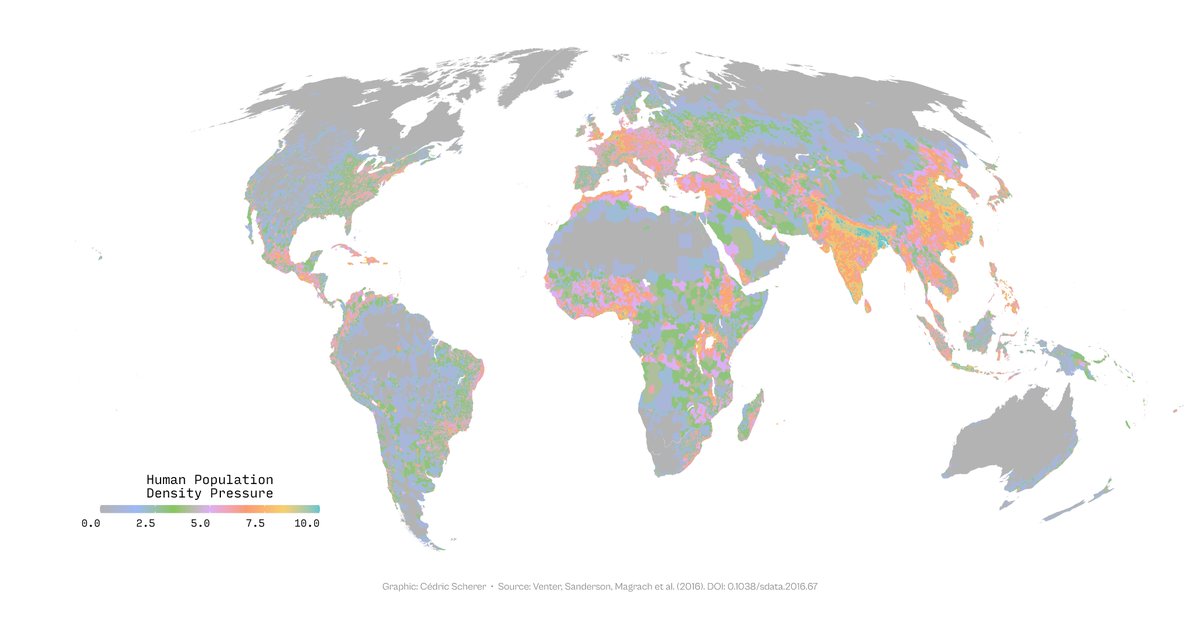
* for quantitative data like this we usually want to use a sequential (map 1+2) or diverging (map 3+4) color palette A world map of human popula...A world map of human popula...A world map of human popula...A world map of human popula...
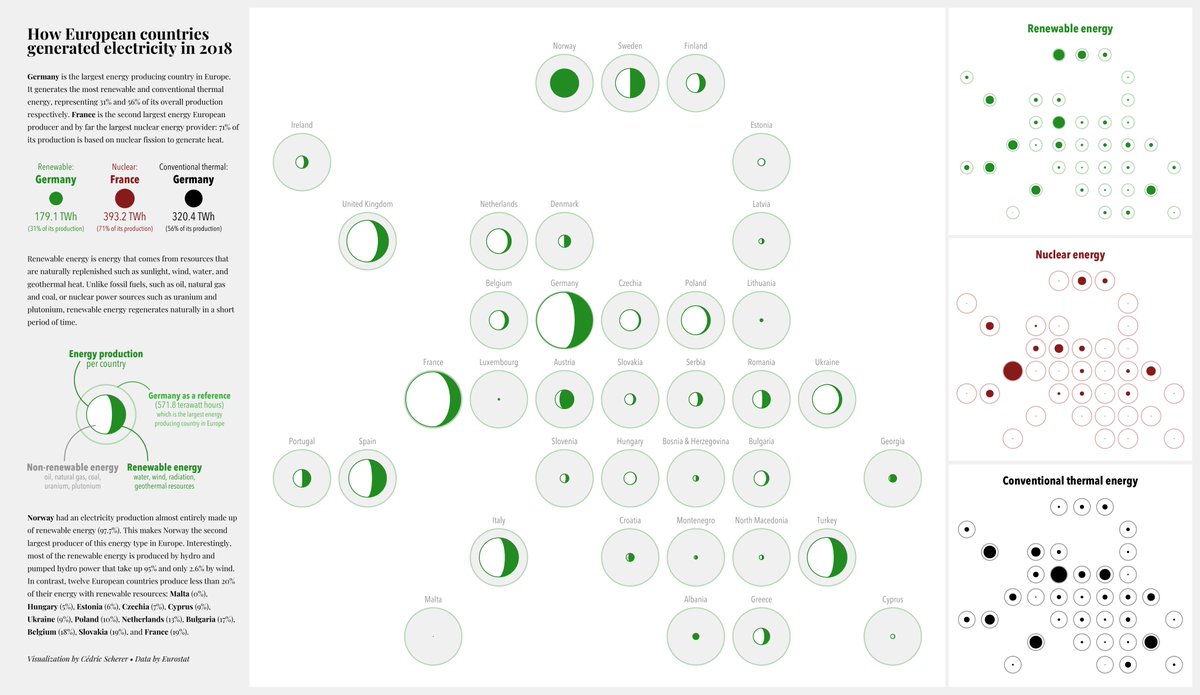
* for sequential palette, the colors with the highest visual weight should be mapped to the values of interest: usually the darker color for higher values on a light background (and vice versa).

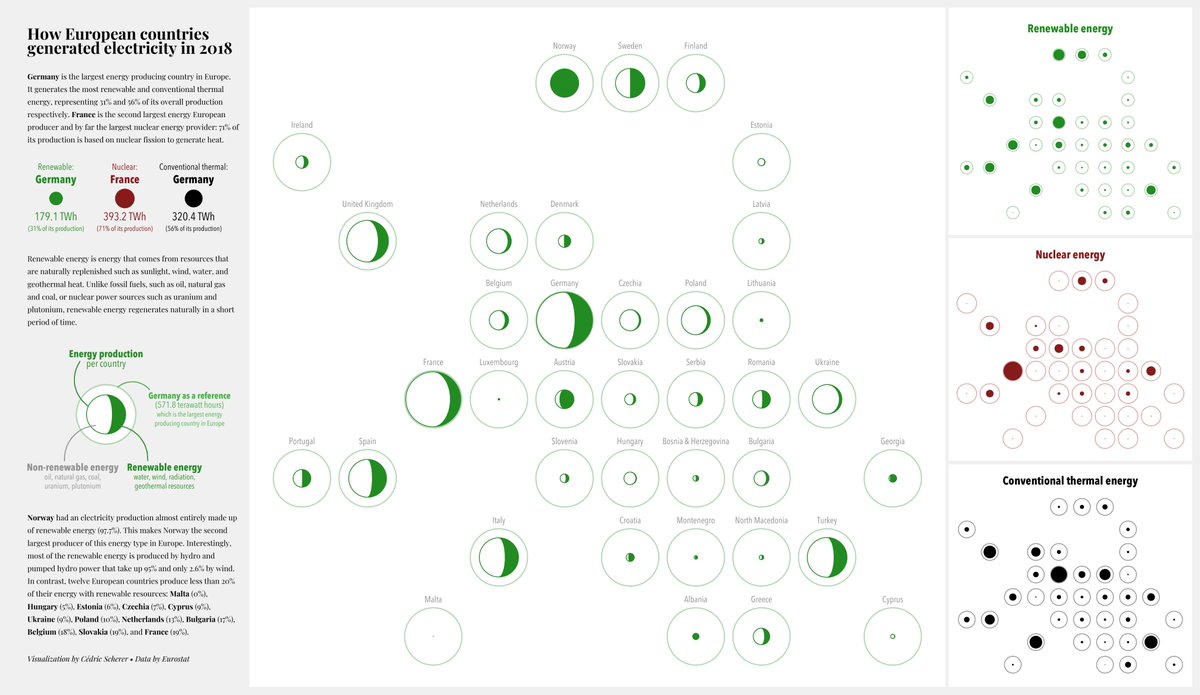
Maps 1+3 put weight on areas with high pressures,
maps 2+4 on low-pressure areas. A world map of human popula...A world map of human popula...A world map of human popula...A world map of human popula...
* when switching to diverging palettes, we focus on both extreme
* for diverging palettes the middle value should be light on a light background (map 1) and dark on a dark background (map 3)

A good article on this by @lisacmuth: blog.datawrapper.de/diverging-vs-s… A world map of human popula...A world map of human popula...A world map of human popula...A world map of human popula...
* don't use a rainbow or related color palettes as they are highly misleading due to perceptual problems (map 1) computer.org/csdl/magazine/…
* there is an improved (but not perfect) rainbow palette called turbo if you need one (map 2) ai.googleblog.com/2019/08/turbo-… A world map of human popula...A world map of human popula...
* don't use qualitative color palettes for quantitative data as, by definition, the colors do not follow a perceptual order. It's easy to extrapolate these palettes and the maps are often very colorful—but not interpretable at all... A world map of human popula...A world map of human popula...A world map of human popula...

• • •

Missing some Tweet in this thread? You can try to force a refresh
 

Keep Current with Cédric Scherer

Cédric Scherer Profile picture

Stay in touch and get notified when new unrolls are available from this author!

Read all threads

This Thread may be Removed Anytime!

PDF

Twitter may remove this content at anytime! Save it as PDF for later use!

Try unrolling a thread yourself!

how to unroll video
  1. Follow @ThreadReaderApp to mention us!

  2. From a Twitter thread mention us with a keyword "unroll"
@threadreaderapp unroll

Practice here first or read more on our help page!

More from @CedScherer

Sep 23, 2021
📊🧵 Collection of tweets featuring open-access materials that I have shared over the last years:
Talks, seminars, blog posts, hands-on notebooks, codes, and more!
#rstats #ggplot2 #tidyverse #dataviz 🧙‍♂️ Title slide of my "ggp...Final visualization of my &...Overview of plots contained...Title slide of my "Bey...
Read 10 tweets
Dec 2, 2020
🔥🔥 MAJOR UPDATE 🔥🔥

The extended "#ggplot2 Tutorial for Beautiful Plotting in #Rstats" is online 🥳

A ton of new examples such as adding annotations, playing with after_scale, new chart types, modifying legends, interactive #dataviz and many more!

🔗 cedricscherer.netlify.app/2019/08/05/a-g… ImageImageImageImage
The tutorial now contains 188 plots and is generated with ~3000 lines of code.
Added topics (1/5):
- several alternative ways to solve things
- short explanation of geoms and theme in the intro
- more on theme elements
- in general a bit more text + explanations
- highlighting difference `scale_x|y_continuous()` vs `coord_cartesian(x|ylim)`
Read 11 tweets
Aug 4, 2020
#TidyTuesday Week 2020/32 ⚡ European Electricity by @EU_Eurostat inspired by @JohnMuyskens, @karim_douieb & @robradburn

Still experimenting with geofacets 🌐 And still experimenting with moon charts 🌘🌒🌖 Not enough green on that chart though.

#r4ds #rstats #ggplot2 #dataviz A geofacet of Europe that s...
Wasn't sure if I like the grey or white version better.
#FridaysForFuture #ClimateCrisis #ClimateAction #ClimateChange Image
Code for this and many other #dataviz'es on my GitHub: github.com/Z3tt
Read 5 tweets

Did Thread Reader help you today?

Support us! We are indie developers!


This site is made by just two indie developers on a laptop doing marketing, support and development! Read more about the story.

Become a Premium Member ($3/month or $30/year) and get exclusive features!

Become Premium

Don't want to be a Premium member but still want to support us?

Make a small donation by buying us coffee ($5) or help with server cost ($10)

Donate via Paypal

Or Donate anonymously using crypto!

Ethereum

0xfe58350B80634f60Fa6Dc149a72b4DFbc17D341E copy

Bitcoin

3ATGMxNzCUFzxpMCHL5sWSt4DVtS8UqXpi copy

Thank you for your support!

Follow Us on Twitter!

:(