Cédric Scherer Profile picture
🧙‍♂️✨📊 Independent #DataViz Consultant & Designer ♢ PhD in Computational Ecology ♢ #rstats #ggplot2 #figma ♢ #graphics #maps #ddj #design ♢ he/him
Mar 14, 2023 16 tweets 19 min read
As the #rstats course material is not public (yet?) or available as online training (yet?), I thought I am sharing some slides from the deck.

The course covers all steps of the #DataScience workflow as featured in @hadleywickham's fantastic #R4DS 📕 r4ds.had.co.nz/index.html The title slide of the workshop "Reproducible Data AnalThree avatars (customised versions of the lovely Open Peeps A chapter slide entitled "What is This Course About?&quA conceptional representation of the data science workflow:t Let's start with session 1:
"Introduction to #rstats and #rstudio" ®️ The title slide for the first session of the "ReproduciA slide explaining what the R programming language is:  &quoA comparison of R and Rstudio, taken from ModernDive: R is tA screenshot of Rstudio with the default panes: Script (uppe
Aug 17, 2022 4 tweets 7 min read
"Graphic Design with #ggplot2" 👨‍💼👩‍💻🧑‍💻

Do you want to recap the 2-day workshop at #rstudioconf? Or do you feel sad you've missed it?

🔥 All course material incl. latest updates can be found on the workshop webpage—9 sessions, 760 slides, 314 ggplots!

👉 rstudio-conf-2022.github.io/ggplot2-graphi… A screenshot of the rstudio::conf(2022) workshop "GraphA screenshot of the title slide of that workshop.The motivational example illustrating the capability of ggpl 
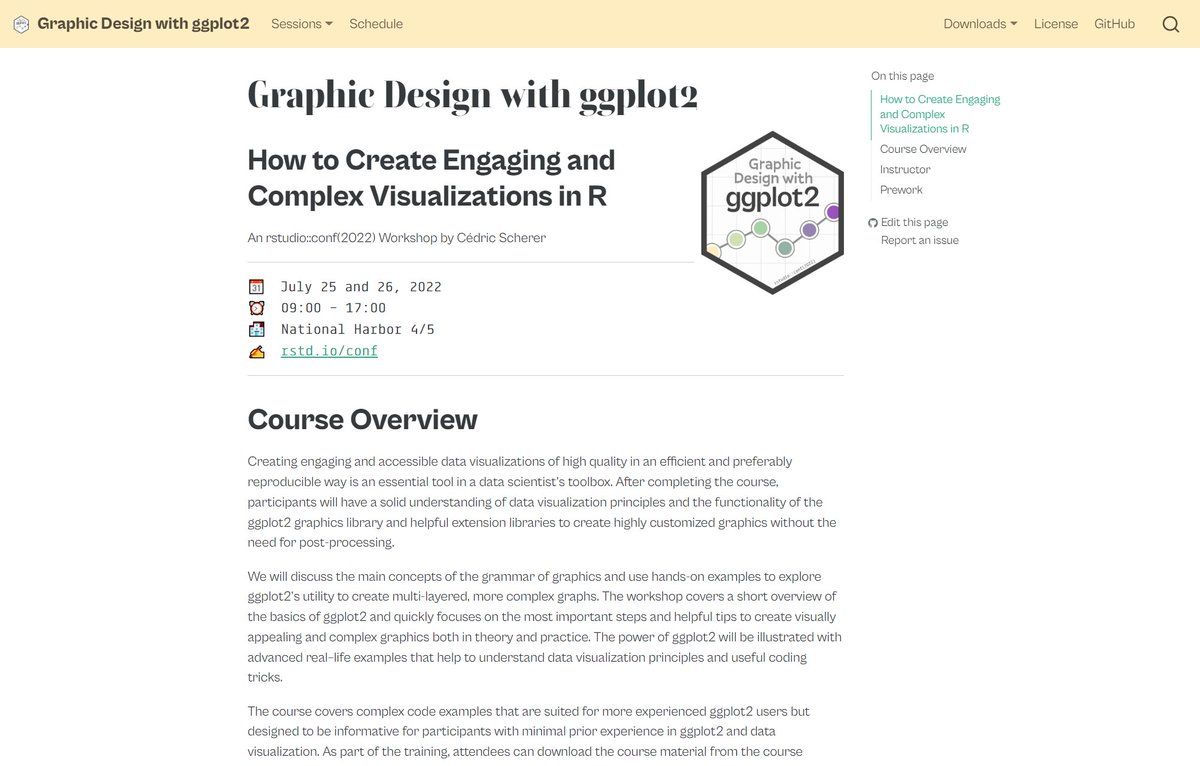
@rstudio The session pages contain not only the slides but
🔵 hands-on #rstats codes
🔵 recap notes
🔵 exercises incl.
🔵 prepared scripts, either as #quarto or #rmarkdown
🔵 step-by-step solutions

➕ all source codes on GitHub: A screenshot of a session page, showing the recap notes and A screenshot of the script to answer exercise 1 of the firstThe title slide of the solution slide deck for exercise 1 inThe raw code for one of the exercises.
May 18, 2022 7 tweets 7 min read
Guess I got a bit side-tracked while creating some (mostly bad) color palette examples for a #datviz training...

1. sequential
2. diverging
3. rainbow
4. qualitative (used for quantitative data) A world map of human popula...A world map of human popula...A world map of human popula...A world map of human popula... 
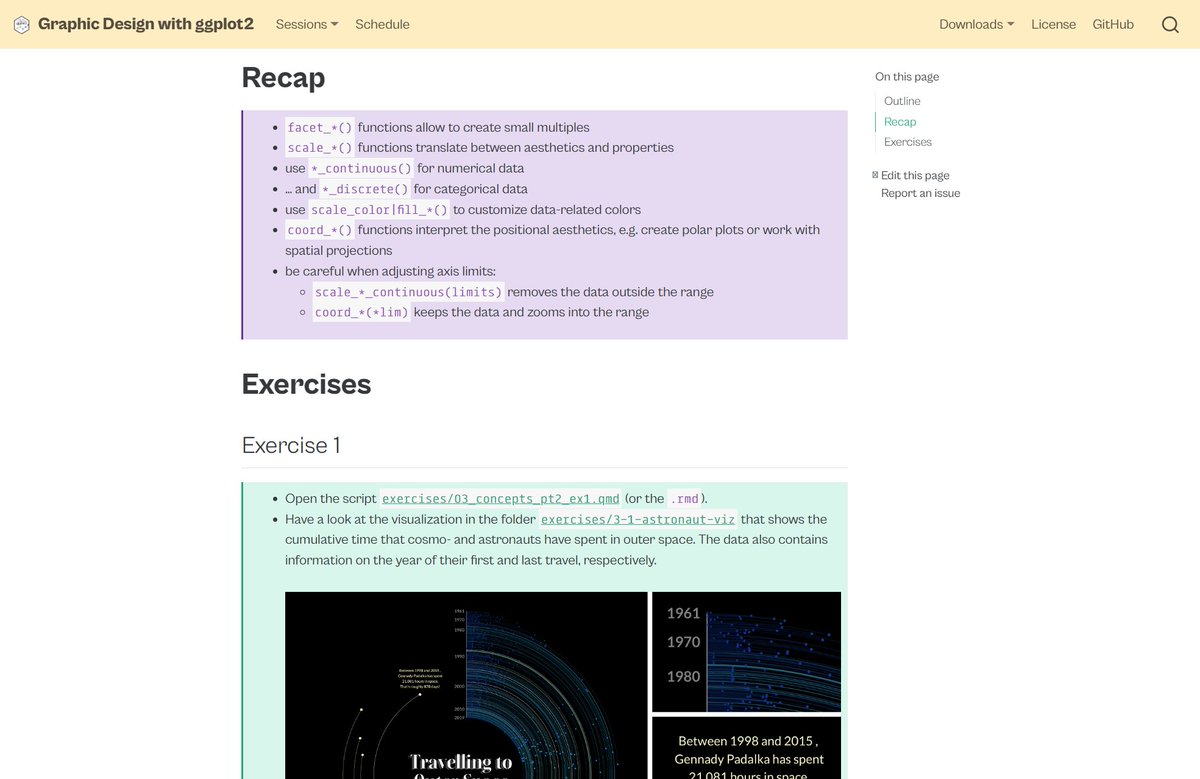
All the colors (so far) 🧡🤎💙💚❤️💜💛 screenshot of my collection...
Sep 23, 2021 10 tweets 8 min read
📊🧵 Collection of tweets featuring open-access materials that I have shared over the last years:
Talks, seminars, blog posts, hands-on notebooks, codes, and more!
#rstats #ggplot2 #tidyverse #dataviz 🧙‍♂️


Title slide of my "ggplot Wizardry" talk at Outlier conference 2021.
Final visualization of my "Evolution of a ggplot2" blog post.
Overview of plots contained in my "A ggplot2 tutorial for beautiful plotting in R"
Title slide of my "Beyond Bar and Box Plots: Chart alternatives and how to design them with ggplot2" talk for USGS
"A #ggplot2 Tutorial for Beautiful Plotting in #Rstats"
Dec 2, 2020 11 tweets 4 min read
🔥🔥 MAJOR UPDATE 🔥🔥

The extended "#ggplot2 Tutorial for Beautiful Plotting in #Rstats" is online 🥳

A ton of new examples such as adding annotations, playing with after_scale, new chart types, modifying legends, interactive #dataviz and many more!

🔗 cedricscherer.netlify.app/2019/08/05/a-g… ImageImageImageImage 
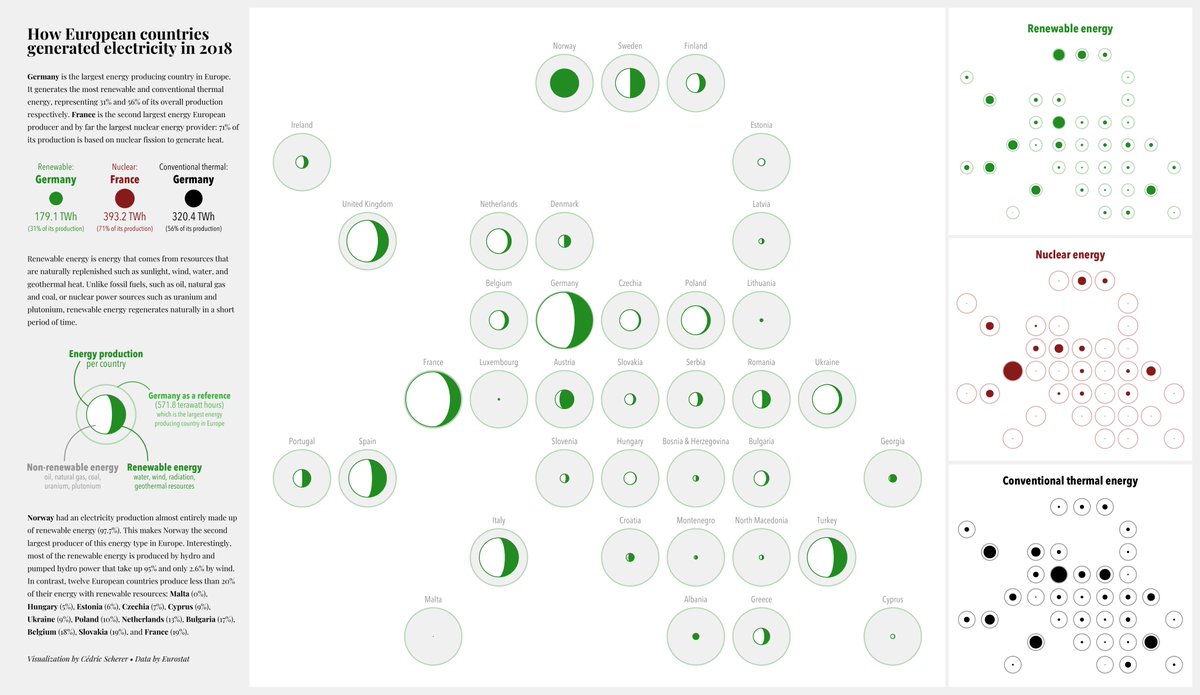
The tutorial now contains 188 plots and is generated with ~3000 lines of code.
Aug 4, 2020 5 tweets 5 min read
#TidyTuesday Week 2020/32 ⚡ European Electricity by @EU_Eurostat inspired by @JohnMuyskens, @karim_douieb & @robradburn

Still experimenting with geofacets 🌐 And still experimenting with moon charts 🌘🌒🌖 Not enough green on that chart though.

#r4ds #rstats #ggplot2 #dataviz A geofacet of Europe that s... Wasn't sure if I like the grey or white version better.
#FridaysForFuture #ClimateCrisis #ClimateAction #ClimateChange Image