#BITCOIN UPDATE THREAD ⚡
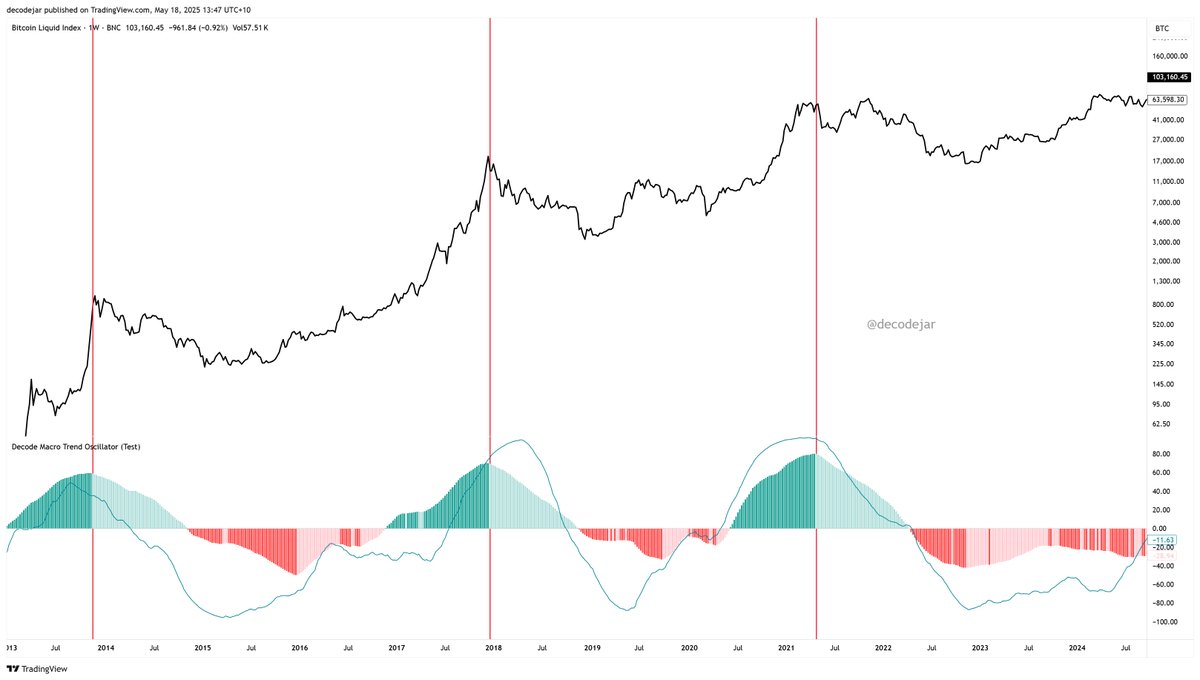
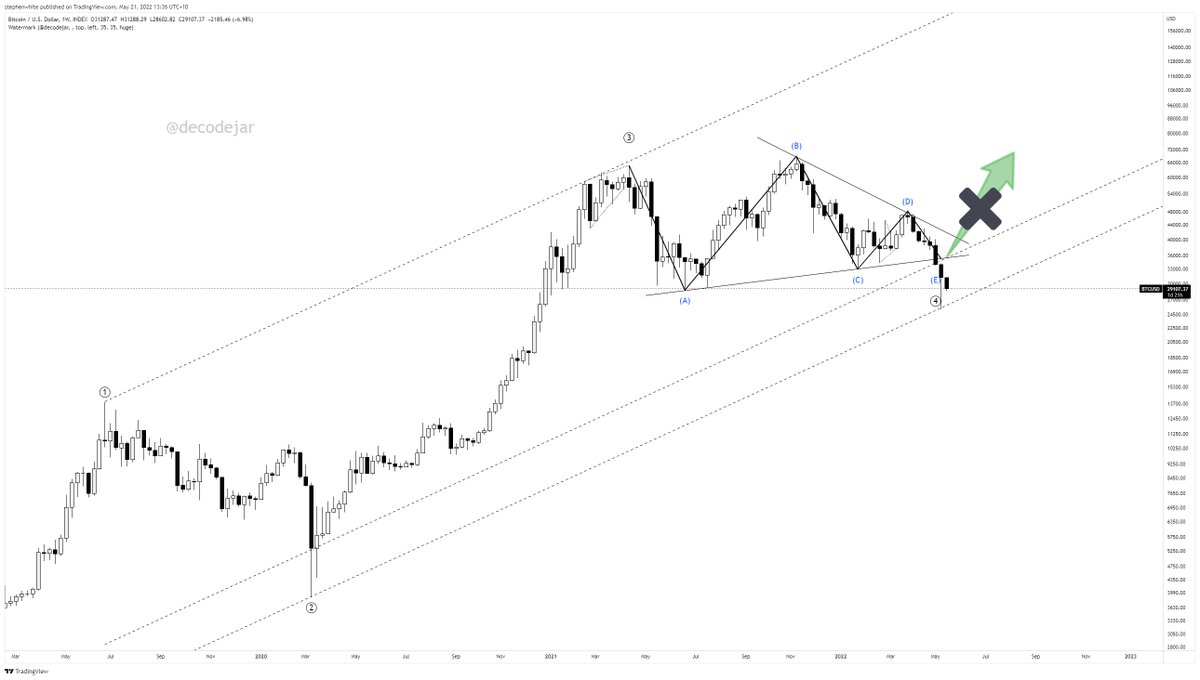
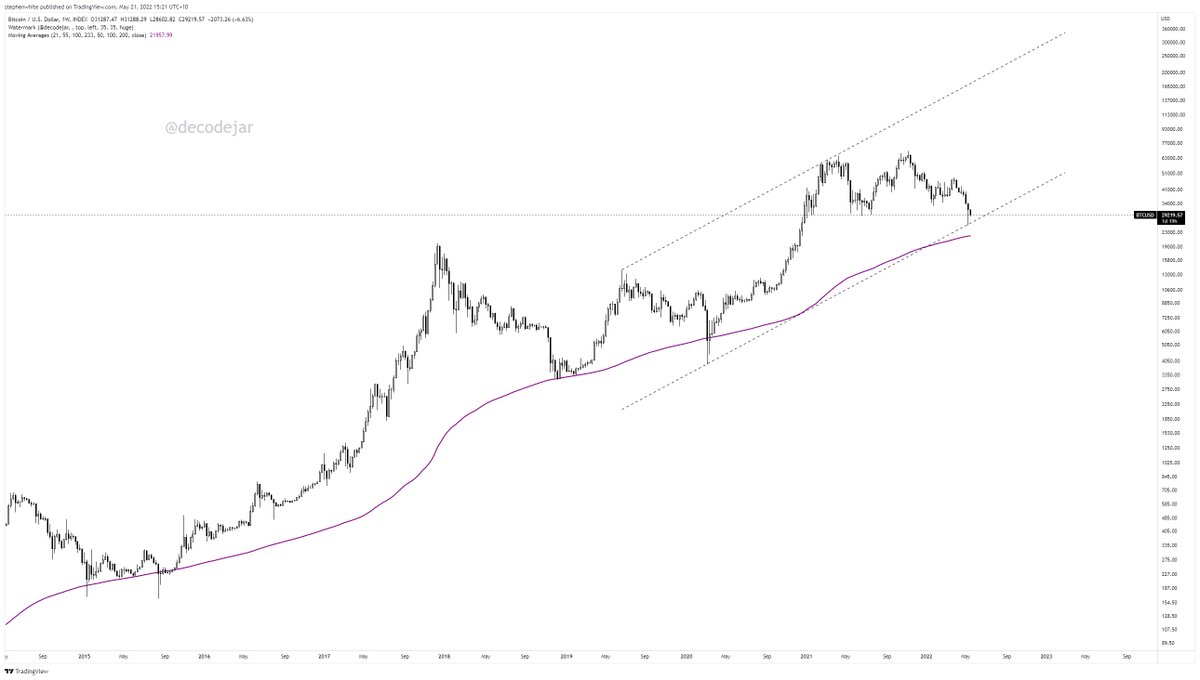
The smaller dashed channel remains my primary case, mapping out waves 1 though 4 with perfect touches at the channel bounds. Wave 5 higher is still missing.
Lots of charts! Lets get into it...
🧵1/
The smaller dashed channel remains my primary case, mapping out waves 1 though 4 with perfect touches at the channel bounds. Wave 5 higher is still missing.
Lots of charts! Lets get into it...
🧵1/

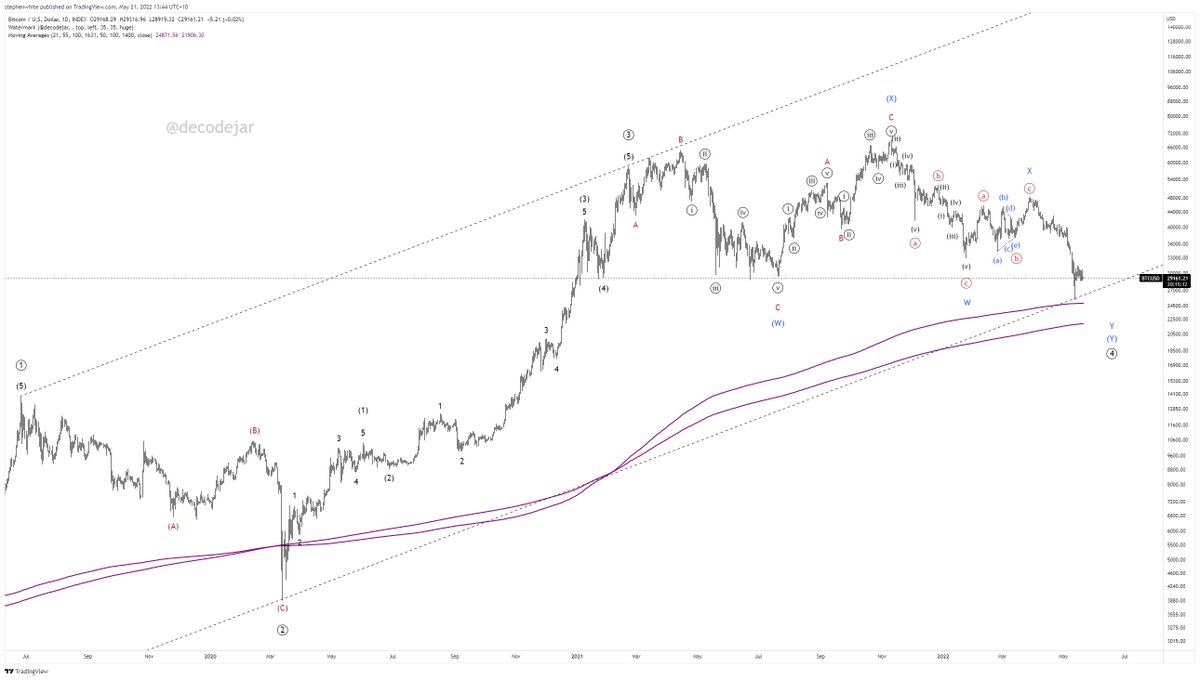
In both channels we can draw a tight lower boundary, as well as one that captures deviations.
In the smaller channel, #Bitcoin has now broken the tight boundary and consumed the full extent of the Covid deviation.
Is the Luna crash simply another deviation?
🧵2/
In the smaller channel, #Bitcoin has now broken the tight boundary and consumed the full extent of the Covid deviation.
Is the Luna crash simply another deviation?
🧵2/

Taking a step back to the failed Triangle count, the mistake was to assume that the market did not need to consume the covid deviation. I was wrong.
Break of 33k #Bitcoin invalidated the Triangle and I switched to my alternate count which I will cover next.
🧵3/
Break of 33k #Bitcoin invalidated the Triangle and I switched to my alternate count which I will cover next.
🧵3/
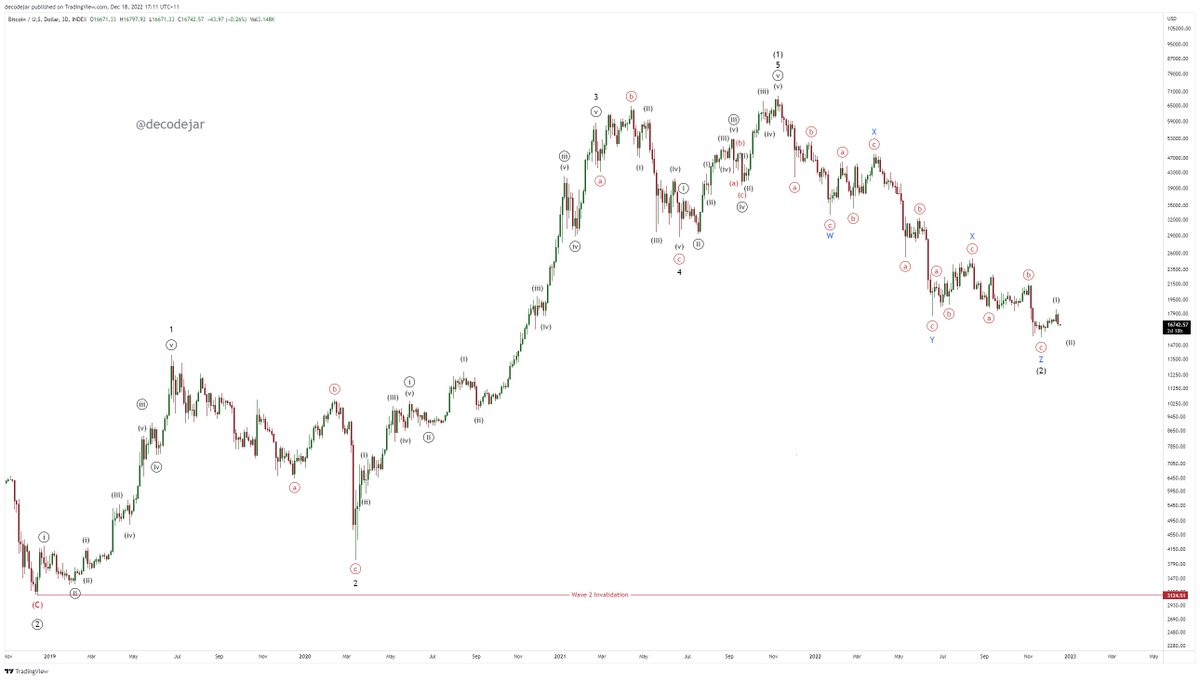
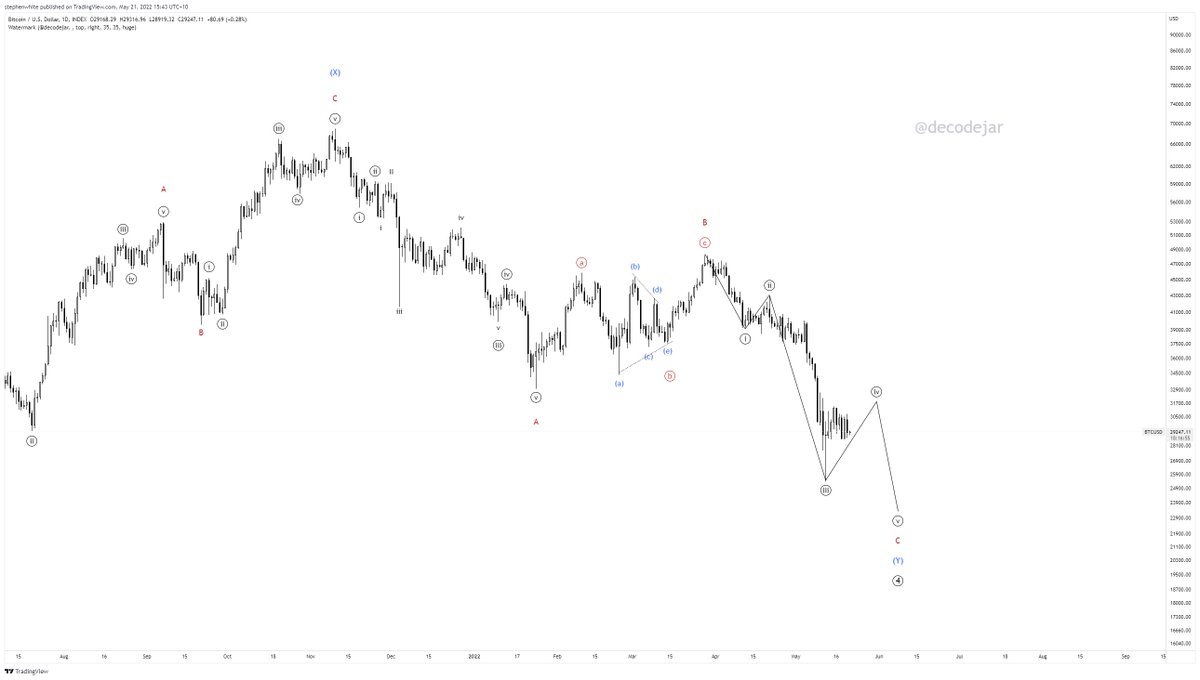
Alternate count in more detail. Double combination, with double zigzag in Y.
Is this count complete at the channel boundary?
🧵4/
Is this count complete at the channel boundary?
🧵4/
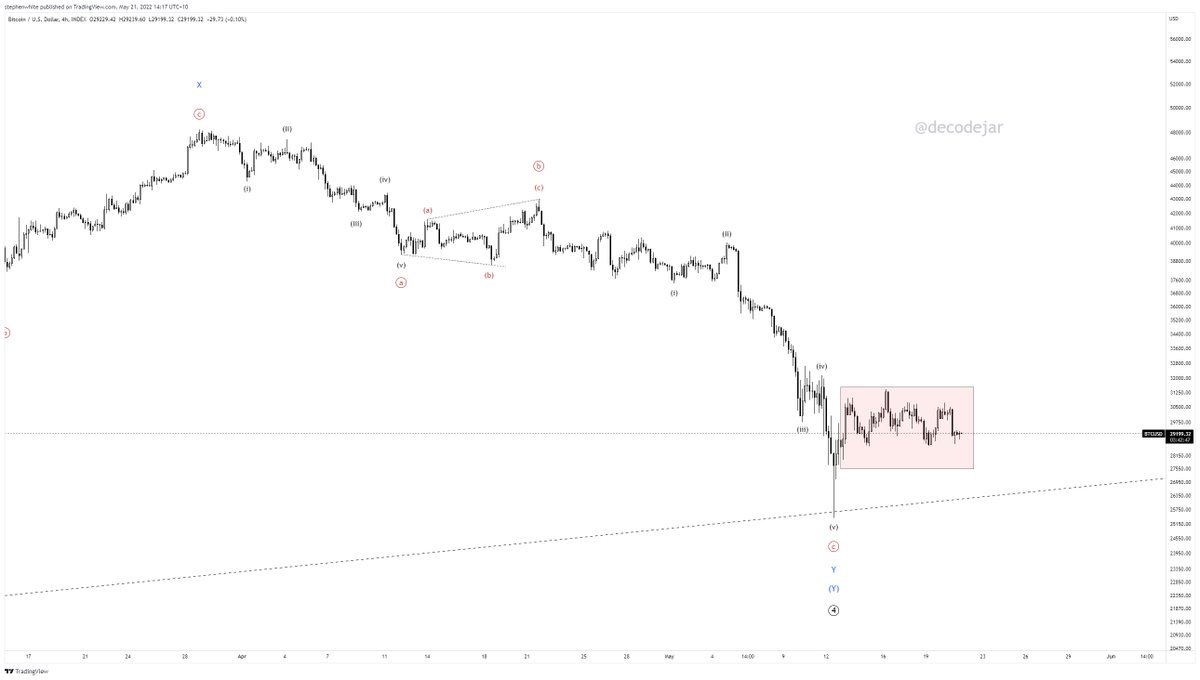
The price action off the low looks corrective, not impulsive, however, #Bitcoin looked a lot like that after the low in June 2021, so on that basis I think this count could be considered complete as shown.
Bearish alternatives next...
🧵5/
Bearish alternatives next...
🧵5/
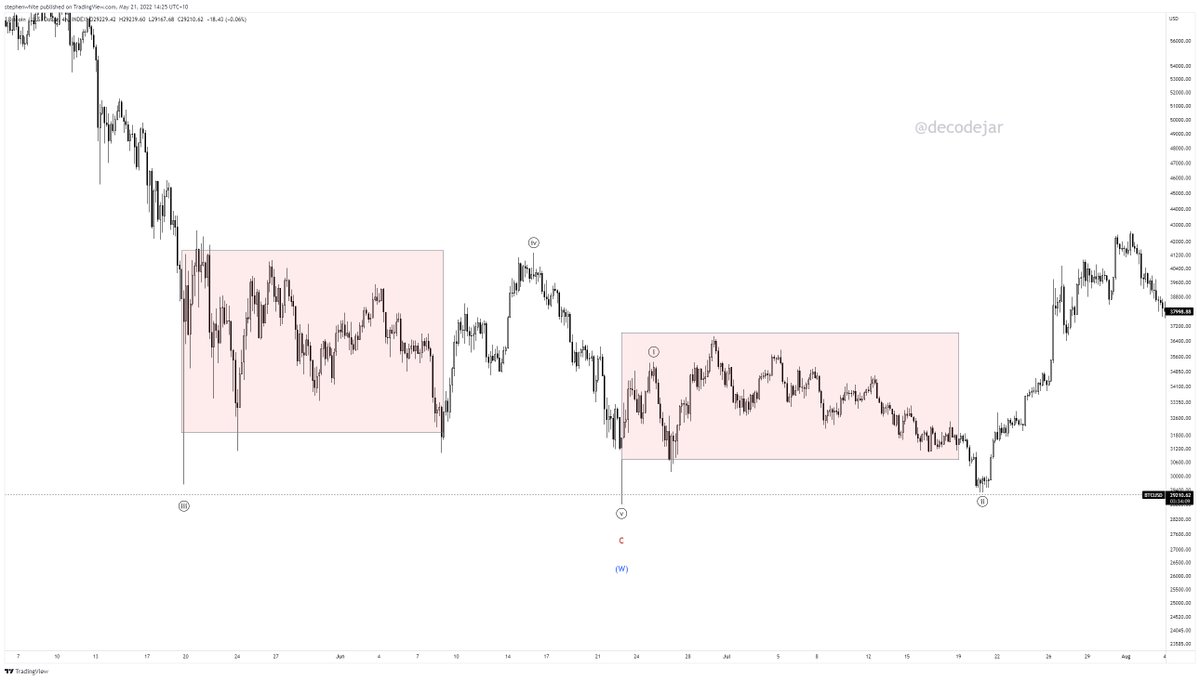
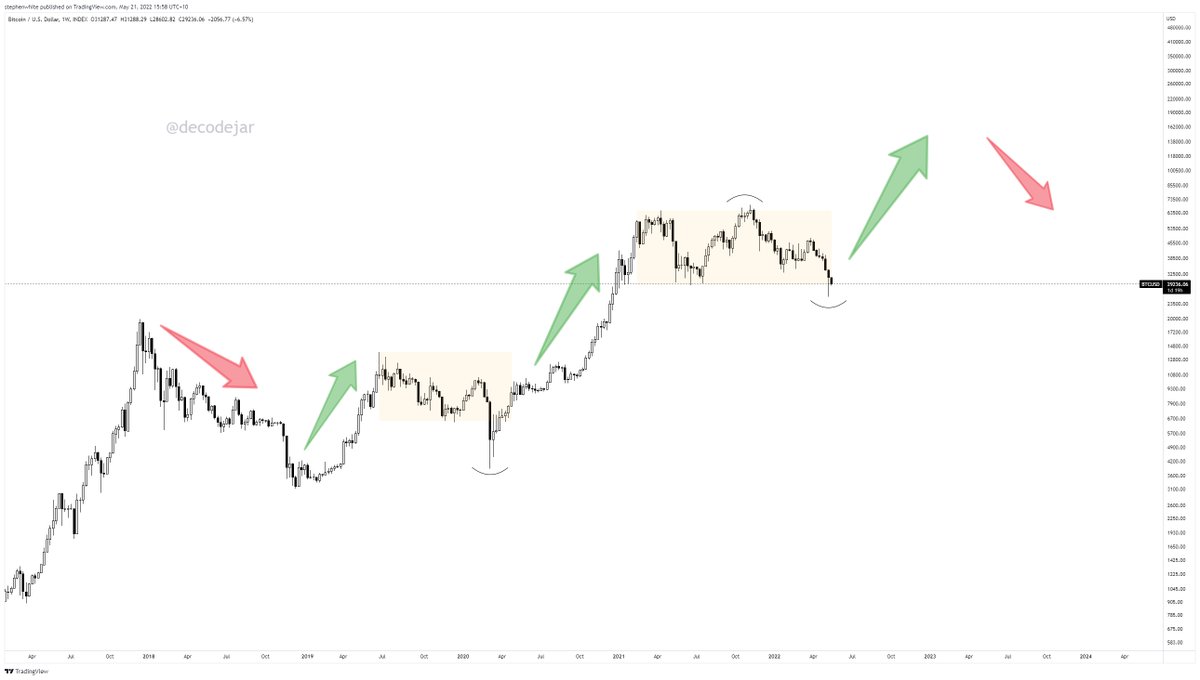
For reference, here is #Bitcoin mid 2021. Corrective price action doesn't necessarily mean we have to put in another low. In one case we went lower, the other we did not.
What we got was an incredible 3 month opportunity to accumulate, so just keep that in mind.
🧵6/
What we got was an incredible 3 month opportunity to accumulate, so just keep that in mind.
🧵6/
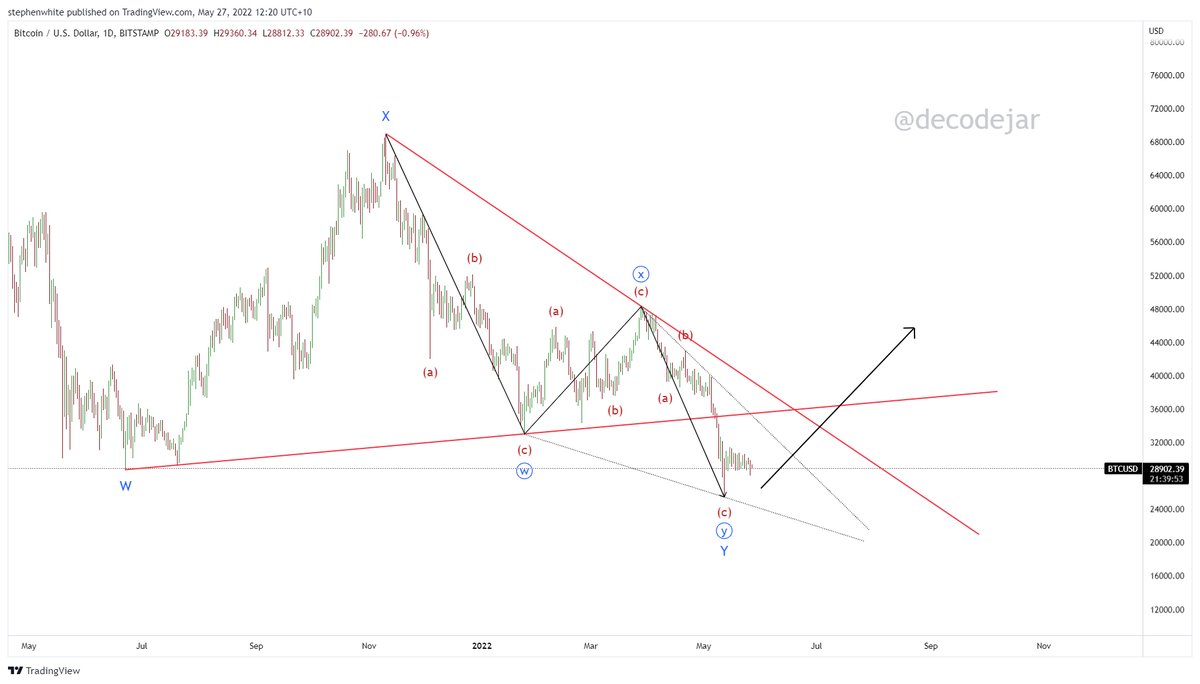
One alternative count is a regular WXY.
This would take #Bitcoin down to it's long term moving averages and provide a more convincing bottom.
I don't like the A wave count because of the Dec liquidation wick, but here it is anyway.
🧵7/
This would take #Bitcoin down to it's long term moving averages and provide a more convincing bottom.
I don't like the A wave count because of the Dec liquidation wick, but here it is anyway.
🧵7/
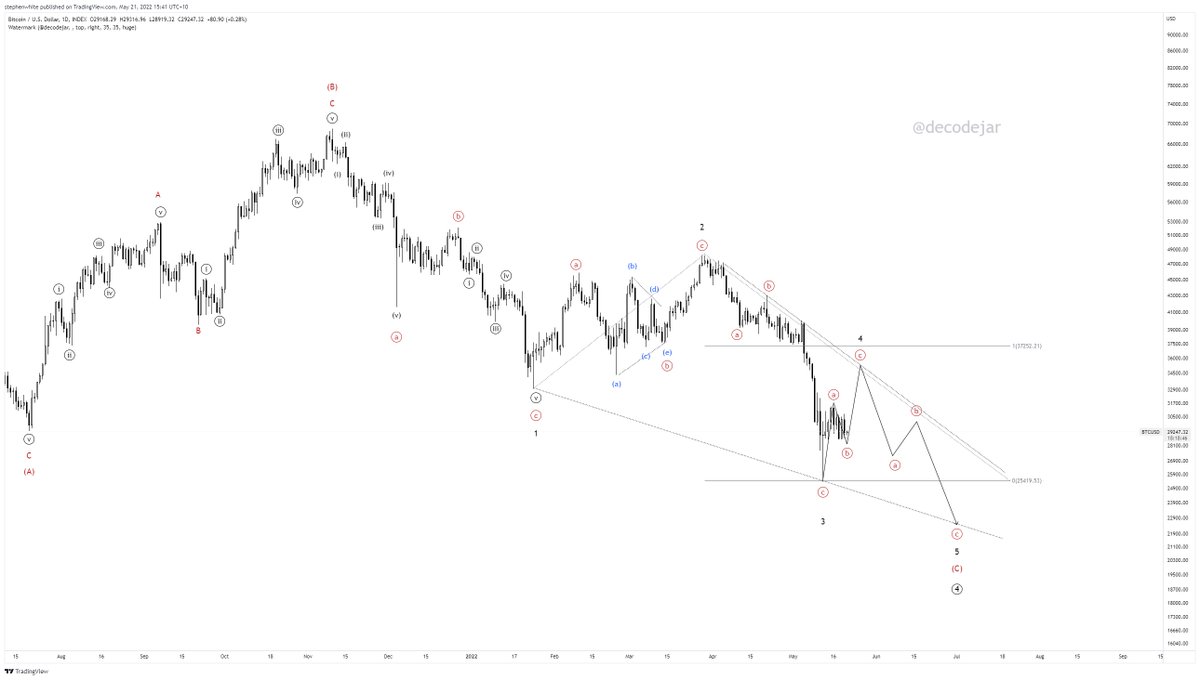
The other alternative for #Bitcoin where there are no ambiguities in the count, is a wave 4 expanded flat with a diagonal in C.
Note this is valid only up to about 37k because 4 needs to be shorter than 2.
🧵8/
Note this is valid only up to about 37k because 4 needs to be shorter than 2.
🧵8/
Because we are so close to the 200wma it is probable that buyers won't come in until we reach it.
However, because I do not see this as a cycle low (even if we touch it), I think it is equally possible that we maintain the channel and find our wave 5 high first.
🧵9/
However, because I do not see this as a cycle low (even if we touch it), I think it is equally possible that we maintain the channel and find our wave 5 high first.
🧵9/
3 counts, 1 bullish, 2 short term bearish, but my overall thesis that we are in a primary Wave 4 correction is still valid whether we hit the 200wma or not.
For me, it's just time to DCA across whatever lows the market gives us, and be ready for wave 5.
#Bitcoin
🧵10/
For me, it's just time to DCA across whatever lows the market gives us, and be ready for wave 5.
#Bitcoin
🧵10/
• • •
Missing some Tweet in this thread? You can try to
force a refresh