Histogram peaks are optimised so that the first light green bar is in alignment with the Bitcoin cycle peak. Perfect signal on the monthly timeframe.
I've been working on a feature to correct the lag that is inherent in the oscillator's smoothing functions, and combined with everything that has already been built, I think this is now the best implementation possible.
If you want to know more about this macroeconomic oscillator, please read the thread below. I’ve spent hundreds of hours developing this, and it’s not just for Bitcoin.
1/
The Decode MTO is not just an indicator, it’s a complex macroeconomic index that calculates almost 40 individual metrics into (currently) 17 leading indicators.
These indicators cover a broad spectrum:
- Interest Rate Dynamics
- Monetary Policy and Global Liquidity
- Manufacturing and Services Sector Activity
- Credit Conditions and Lending Standards
- Corporate Bond Market Health and Risk Appetite
- Market Volatility
- Industrial Sector Performance
- Commodity-Based Economic Health Proxies
- Consumer Sentiment and Behaviour
- Currency Strength
- Other Composite Indexes
Indicators are normalised to preserve their own specific signal and then aggregated to produce a histogram for a clear visual representation of economic cycles. I’ve enabled a few key metrics as line graph overlays in the example chart here.
One thing I notice on this chart is the striking similarity between today and the late 80s to early 90s. Back then, inflation was high and working-class families were struggling. I was just a kid, but I remember we had no money, and my parents were finding it difficult to make ends meet.
Deep in the red on the histogram for several years in both cases, the main difference only that this time we have avoided a technical recession. In the 90s when the histogram finally flipped green, we saw a period of growth roughly equal in length.
Today we see the histogram getting closer to its first green print.
Also, a lesson on how to measure wave 5 targets (instead of pulling numbers out of thin air) and draw correct Elliott Wave base and trend channels.
Wave 5 can be measured three ways:
- equal the height of wave 1 (68,692)
- 0.618 the… twitter.com/i/web/status/1…#Bitcoin Low Time Frame Alternate Count.
The base channel fails as support on the first attempt, but price is contained by the trend channel, before moving higher.
Looks incomplete with one leg lower still to play out. Must complete above 13,870 or invalid. 2/ #BTC Wave 2 Double Zig-Zag correction.
Combination of small zig zag followed by large zig zag. Also incomplete with one leg lower still to play out on #Bitcoin
Dec 17, 2022 • 4 tweets • 2 min read
Seems to me the #Bitcoin bottom is more likely in than not. Everyone hates everyone. Everything is scam. Every red candle is some degen getting liquidated. Too much narrative. Too much fear.
If you look at the charts, the #Crypto market as a whole has gone nowhere in six months.
If you're selling out of your positions, instead of taking the opportunity to accumulate and grow them at these levels, I really think you're going to look back and regret that decision.
And I'm not talking trading, I'm talking about opportunity for long term portfolio growth.
Generally speaking, when the news is universally bad and the sentiment is at all time lows, I am a buyer. I buy slowly and consistently across the months when the market is hunting for a bottom.
1/
My obsession with charts means I am always looking for the exact bottom. I want to know when it is approaching and when it has passed, but my investment timeframe means I have no need to buy the exact candle.
The smaller dashed channel remains my primary case, mapping out waves 1 though 4 with perfect touches at the channel bounds. Wave 5 higher is still missing.
Lots of charts! Lets get into it...
🧵1/
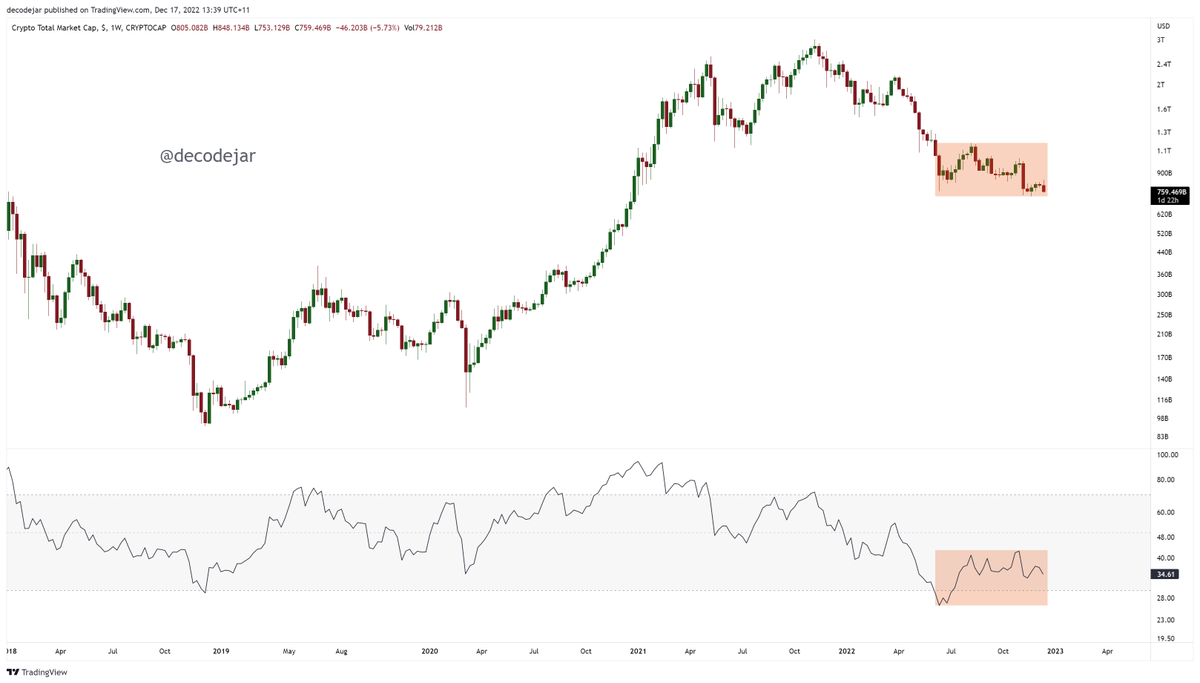
In both channels we can draw a tight lower boundary, as well as one that captures deviations.
In the smaller channel, #Bitcoin has now broken the tight boundary and consumed the full extent of the Covid deviation.
I prefer this WXY over an ABC running flat because of low volume in the would-be C wave, and it counts better as a zig-zig. I'm being technical, but it changes the options.
Is it finished?
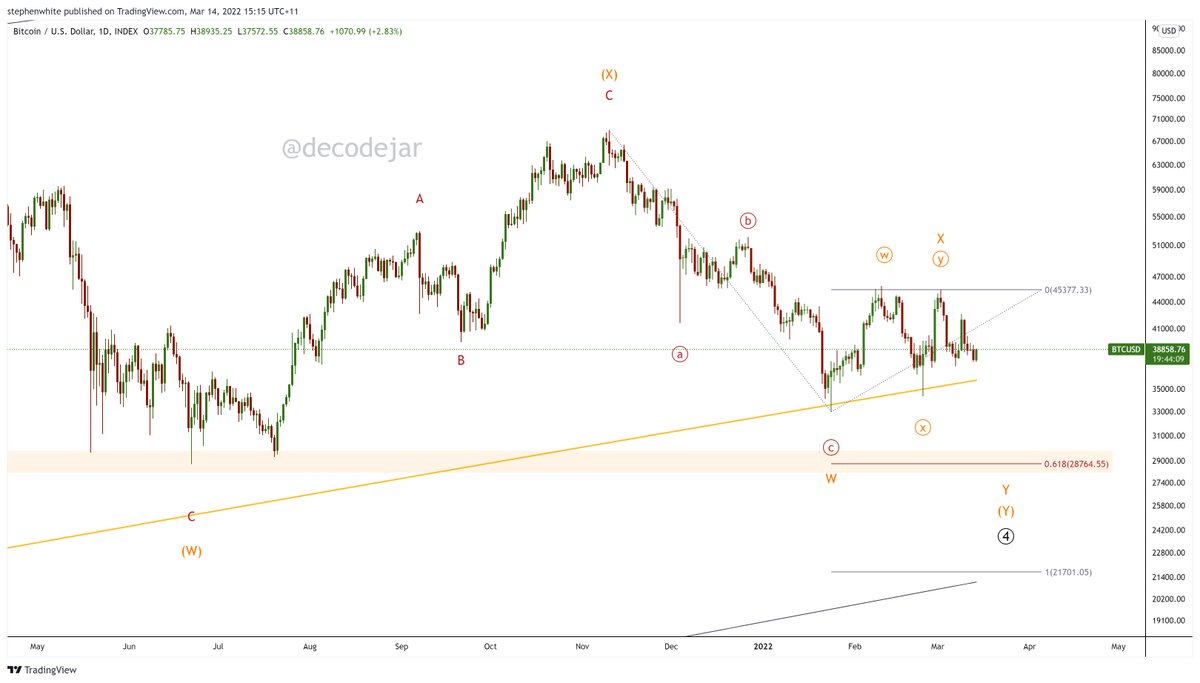
🧵👇 2/ Wave 4 Running Triangle.
The WXY is a three wave structure; as is an ABCDE triangle. Two more three wave swings would give us a neat triangle.
The E wave could hold 40k support or find the lower trendline. That would suck in the H&S bears nicely!