glassnode Profile picture
May 25 5 tweets 5 min read
What #Ethereum applications have the highest demand? To find out, we followed where users spent the most gas.

In our latest research piece, we explore the dynamic and ever changing usage profile of #Ethereum, from #ERC20 tokens, to #DeFi, to #NFTs

1/5🧵

glassno.de/etherverse
Over time, #Ethereum has been many things, and we can clearly see these trends emerge within Gas consumption dominance.

Notable #Ethereum usage dominance today:
- 30% NFTs
- 13% DeFi
- 8% $ETH transfers
- 5% Stablecoins
- 5% Bridges

2/5

Live Chart: glassno.de/39Uw5Xx Image
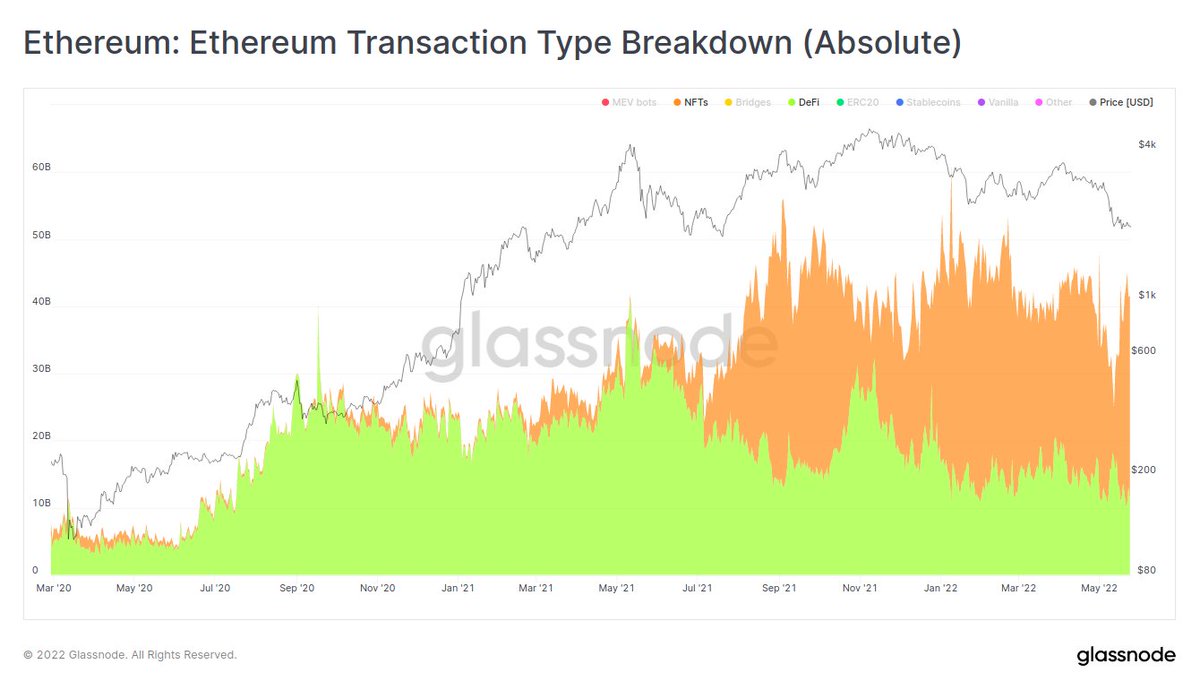
Through observation of #Ethereum network usage, we can identify shifting market preferences.

The chart below clearly demonstrates the expansion of the #NFT trend 🟧, taking off in mid-2021, and absorbed market share relative to DeFi 🟩

3/5
Live Chart: glassno.de/39SRYqu Image
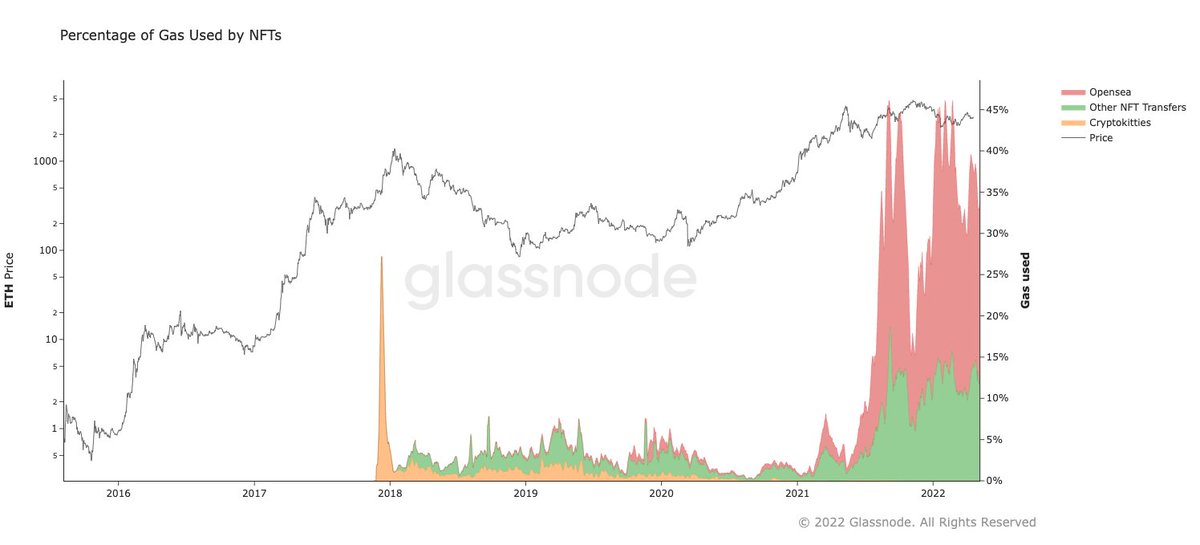
#NFTs currently command 30% to 45% of daily #Ethereum gas consumption, and transaction counts on-chain.

@opensea remains one of the largest NFT trading platforms, capturing a large share of user demand in 2022.

4/5 Image
As #Ethereum continues to evolve as a platform, new use cases will be discovered, and user demand can shift.

Our analysis explores the history of the Etherverse, told through the lens of gas consumption, usage trends, and transaction dominance👇
glassno.de/etherverse
5/5

• • •

Missing some Tweet in this thread? You can try to force a refresh
 

Keep Current with glassnode

glassnode Profile picture

Stay in touch and get notified when new unrolls are available from this author!

Read all threads

This Thread may be Removed Anytime!

PDF

Twitter may remove this content at anytime! Save it as PDF for later use!

Try unrolling a thread yourself!

how to unroll video
  1. Follow @ThreadReaderApp to mention us!

  2. From a Twitter thread mention us with a keyword "unroll"
@threadreaderapp unroll

Practice here first or read more on our help page!

More from @glassnode

Mar 10
Tracking on-chain #Bitcoin accumulation can be complex and nuanced to accurately analyse.

We are pleased to release the #Bitcoin Accumulation Trend Score, a metric designed to track when larger players or a large part of the market is accumulating.

1/4🧵
glassno.de/3J3grpJ
2/4
We combine wallet participation in different cohorts, with balance change to assess buy-side pressure.

This idea was first pioneered by @ecoinometrics, and further refined and entity-adjusted by our team.

Methods and examples in Glassnode Academy.

glassno.de/3pV0iuW
3/4

Interestingly, price insensitive HODLers of all wallet sizes have been accumulating in sizIn the current market, we see balanced supply and demand, as macro uncertainty tests $BTC HODLer conviction.e throughout 2022.

This differs to the clear distribution seen in mid-2021.
Read 4 tweets
Mar 1
The #Bitcoin network has just settled almost $9B in change-adjusted volume within a single block.

Alongside a recent increase in wallet address > 100 $BTC, this raises questions as to whether it is whale accumulation.

Charts below are 7-day view at 10min resolution.

1/4
What we see is that there has been a peak of only $225M in $BTC value withdrawn from all exchanges we track in this time period.

This is much lower than the $9.0B in total volume.

As such it is unlikely this volume and address count spike represents a massive buyer(s).

2/4
If we look to exchange in-house transfer volume, we see two recent transactions of $4.1B and $3.5B were recently moved, specifically by Binance.

This makes it most likely that the uptick in addresses holding 100 $BTC+ is associated with internal exchange wallet reshuffling.

3/4
Read 4 tweets
Dec 6, 2021
Assessing the $BTC Sell-off🧵:

#Bitcoin holders realised the third largest on-chain capitulation in history over the weekend, with over $2.18B in realised losses.

This compares to:
- $1.38B in March 2020
- $2.65B in May
- $3.45B in June

1/4

Live Chart: glassno.de/3EzM8os
Question is, which cohort of #Bitcoin holders were realising these losses?

If we look to Long-Term Holder supply, we can actually see their total holdings are unchanged over the past week

This makes it more probable it was recent buyers

2/4

Live Chart: glassno.de/3pBlhlE
The Short-Term Holder SOPR metric on the other hand shows very significant losses were realised by this cohort.

Spending by STHs was the least profitable it has been since the $29k lows set back in July.

3/4

Live Chart: glassno.de/31nLs7j
Read 4 tweets
Jun 28, 2021
1/ Yesterday, it took on average 1400s (or 23.3 min) to mine a #Bitcoin block. This denotes the largest daily mean block interval since the very early Bitcoin days.

Chart: glassno.de/3xV7EQs
2/ In fact, only 58 #Bitcoin blocks were mined throughout the entire day – which represents a drop of 60% from the baseline of 144 / day.

Chart: glassno.de/3vYXjBF
3/ Daily #Bitcoin miner revenue fell from over $70M in May down to $12.8M yesterday (-80%).

It amounts to the same revenue miners were earning in early November when the price of $BTC was at around $13,000 per bitcoin.

Chart: glassno.de/3x2qfdz
Read 5 tweets
Apr 27, 2021
#Bitcoin is a cyclical market, and whilst price is rarely predictable, human responses often are.

On-chain analysis studies coin spending patterns, providing a guide to where we are in market cycles.

A thread on our latest piece with @BitcoinMagazine
glassno.de/3tVCTti
1/7
Long term HODLers are the buyers of last resort

Their typical spending pattern is accumulation in the bear and distribution in the bull.

Realized Cap HODL waves show both swelling of HODLer supply, coin maturation and spending of profits

Live Chart: glassno.de/333WM5L
2/7
Spent Output Age Bands provide insight into when old coins are on the move.

Historically, old coins are spent to realise gains in bull markets, or in periods of high bearish volatility.

Lately, older coins have slowed their spending.

Live Chart: glassno.de/3eyOW9l
Read 8 tweets
Mar 16, 2021
1/ Addressing yesterday’s exchange data – we remain with our statement.

The transactions in question were not external user deposits into Gemini's cluster.

This is in accordance with our address labels and clustering information.
2/ We have automated QA systems in place that are triggered and prevent the initial propagation of potential misleading information.

This prevents many false positives, e.g. when exchanges create new wallets and reshuffle funds.
3/ Yesterday’s event of algorithmically inferring the transaction as in-house was driven by multiple attributes of the cluster in question, among them:

- Recurring significantly large transactions
- High percentage of txs with Gemini
- Cluster balance pattern (“sawtooth”)
Read 7 tweets

Did Thread Reader help you today?

Support us! We are indie developers!


This site is made by just two indie developers on a laptop doing marketing, support and development! Read more about the story.

Become a Premium Member ($3/month or $30/year) and get exclusive features!

Become Premium

Don't want to be a Premium member but still want to support us?

Make a small donation by buying us coffee ($5) or help with server cost ($10)

Donate via Paypal

Or Donate anonymously using crypto!

Ethereum

0xfe58350B80634f60Fa6Dc149a72b4DFbc17D341E copy

Bitcoin

3ATGMxNzCUFzxpMCHL5sWSt4DVtS8UqXpi copy

Thank you for your support!

Follow Us on Twitter!

:(