
Digital asset data, analytics, and research.
https://t.co/VrKU3mBzsv
https://t.co/Ofq0n0yjN3
 Front-end skew reaction
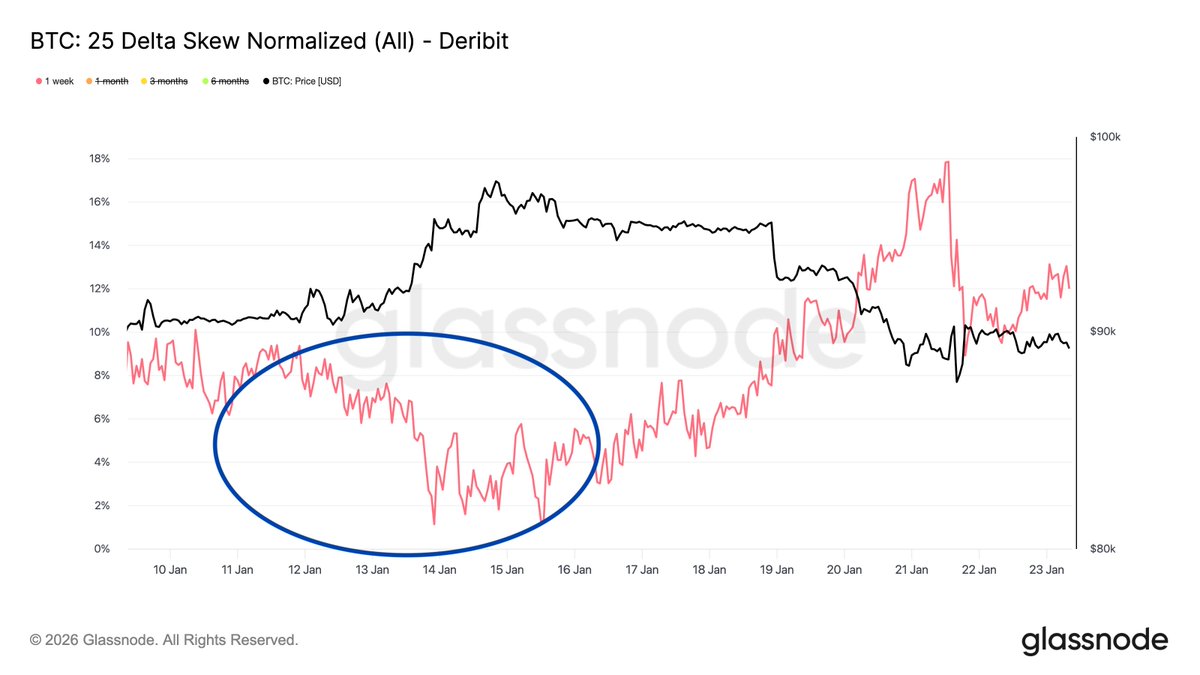
 OI: Call-Leaning Positioning
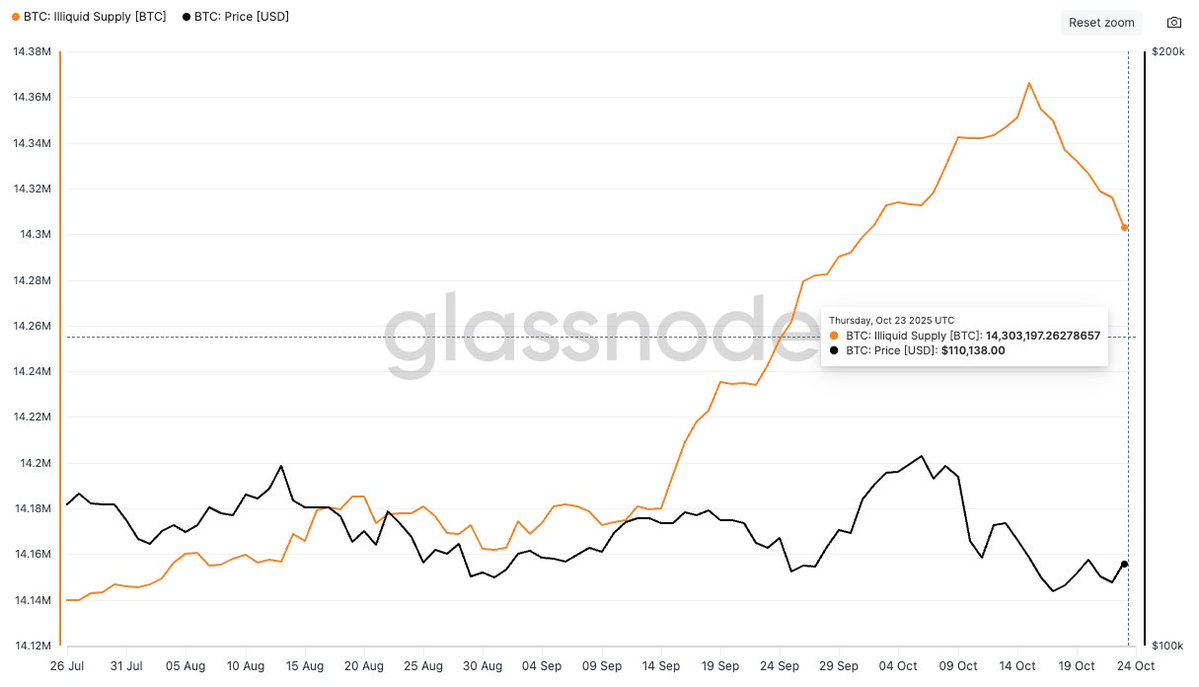 Illiquid supply has been a major tailwind this cycle, but the latest pullback breaks that trend. Similar declines have historically cooled momentum as supply returns to market, and we’ve seen far bigger outflows before, like the 400K BTC in Jan ‘24.
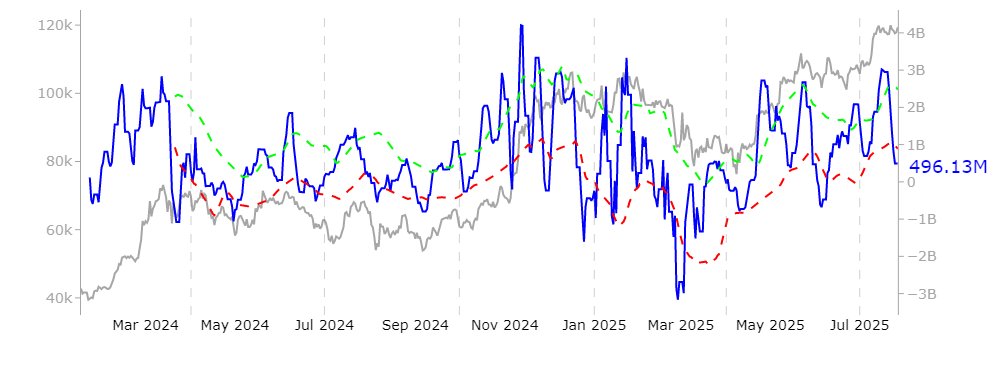
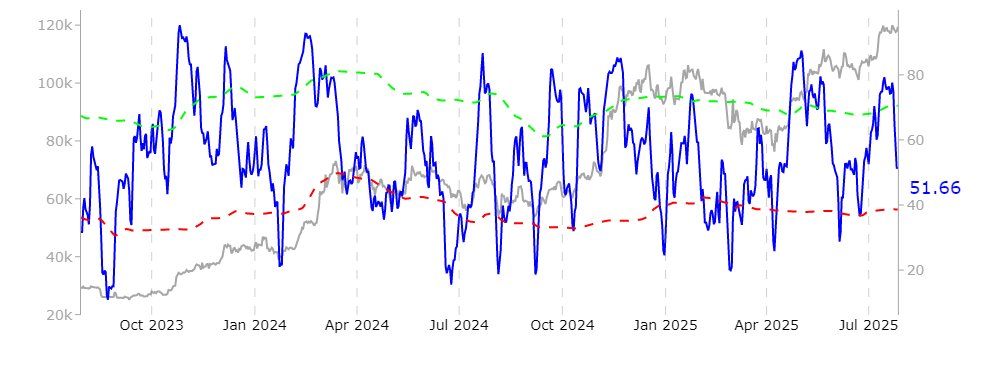
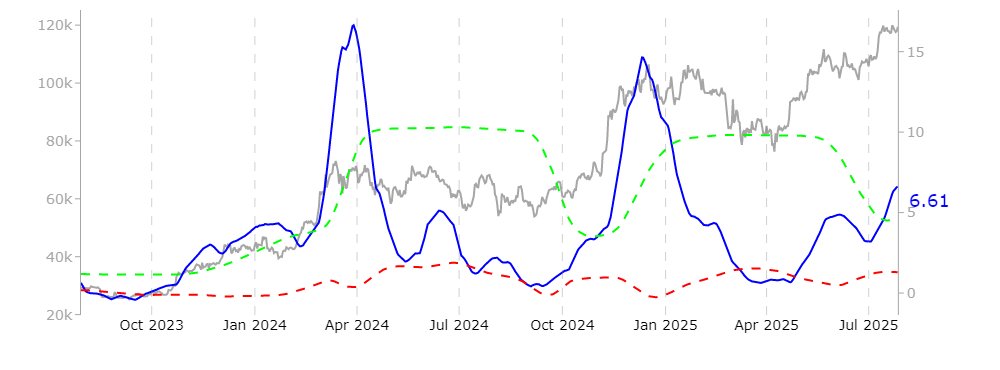 Off-chain indicators remain mixed:
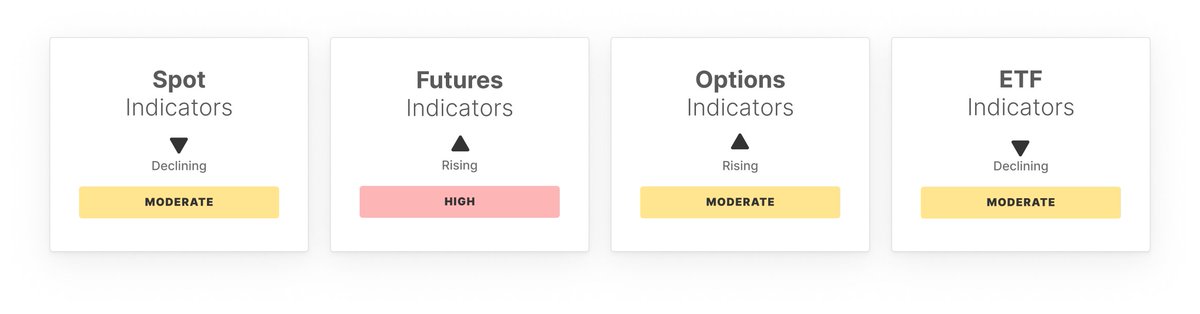
 The recent rally to $122k has pushed #Bitcoin close to 1 standard deviation above the short-term holder cost basis. If this momentum continues, the next key level is $136k (2 +std), a zone that has historically marked elevated profit-taking and local market peaks.
 "The Percent Supply in Profit [...] is notably above the high band [...]. Such a scenario could lead to heightened sell-side pressure as investors may opt to realize gains."
 Our statistical analysis shows, for every tenfold increase in holding time, the probability of spending drops by a factor of 10. This trend holds consistently, revealing tenacious behavioral patterns that help investors understand and anticipate market dynamics with greater confidence.
 $BTC market cycles traditionally follow a progression: early in the cycle, long-term holders dominate. By the peak, short-term holders (new investors) often hold over 70%-80% of wealth.
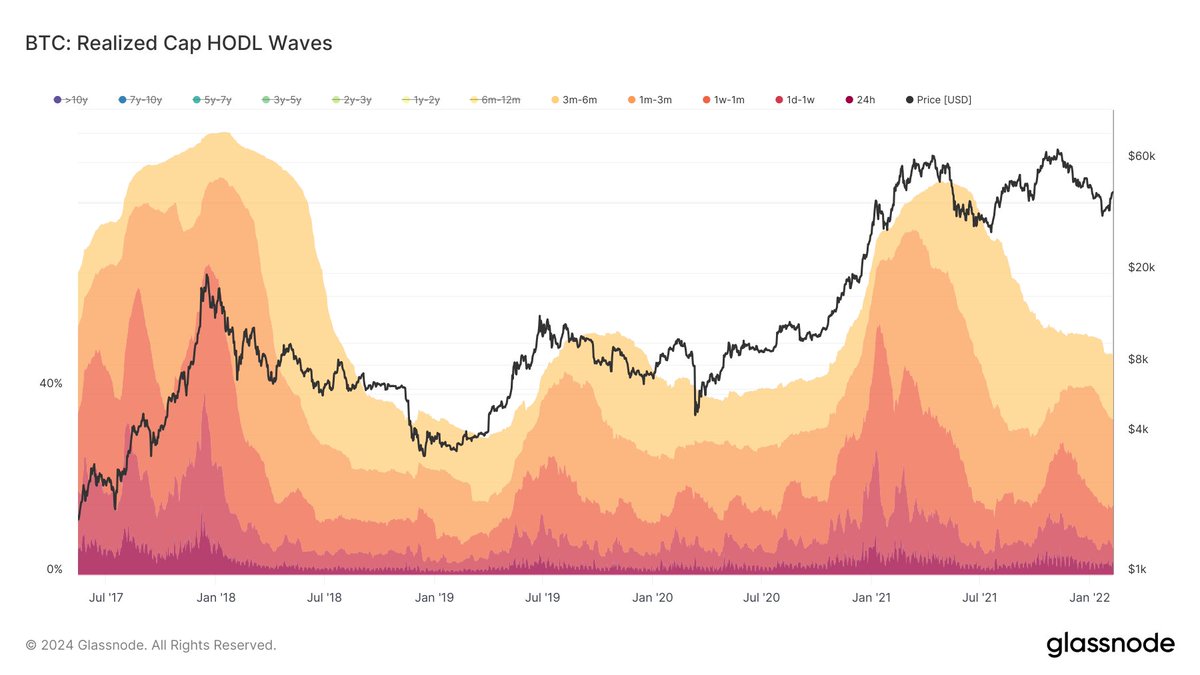
 CBD is a heatmap that shows the total #Bitcoin supply grouped by the average cost basis of investors at specific price levels. By visualizing where cost bases are concentrated, CBD helps identify key zones of support and resistance based on investor behavior.
 Among LTHs, the 6m-12m cohort led the charge, spending an average of 25.6K BTC/day in profits. Most of the recent selling activity came from this specific group of investors: glassno.de/3CF66lA
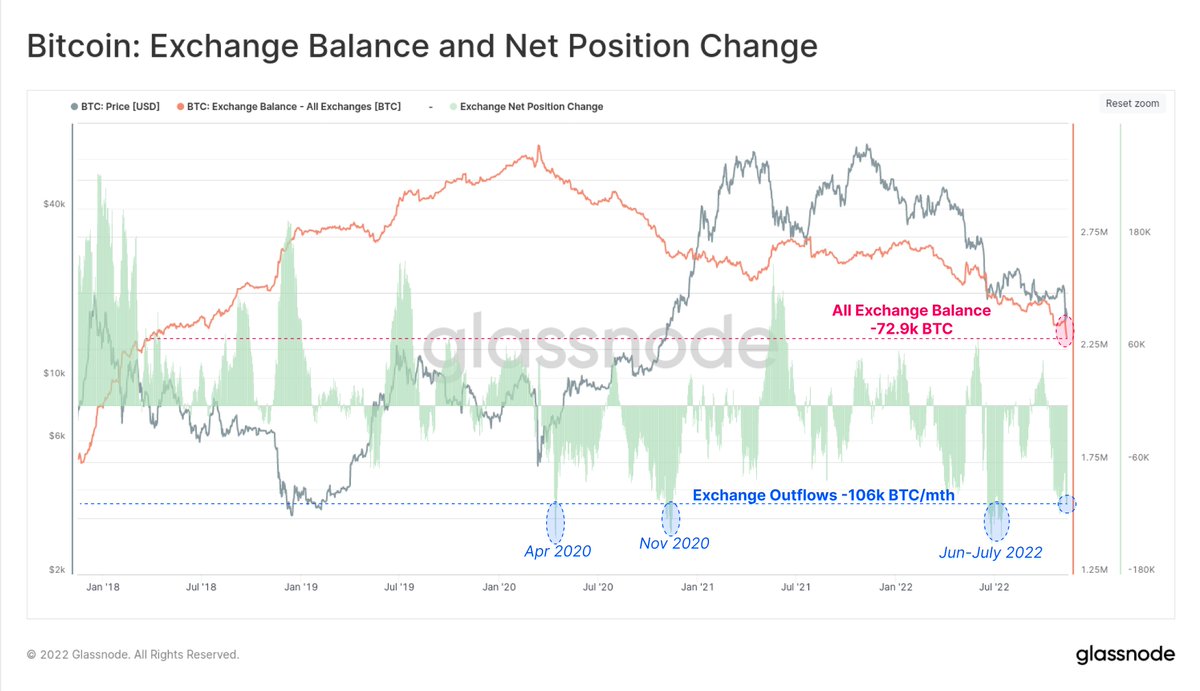
 When assessing the net outflow in USD terms, we note a value of -$277M, the 15th largest on record. Again, when comparing this to the peak net outflow of $1.04B, the current value remains -$763M (-73%) smaller.
 We can see major shifts underway in stablecoins, with #USDT supply at new ATHs, whilst #USDC and #BUSD fall to multi-year lows.
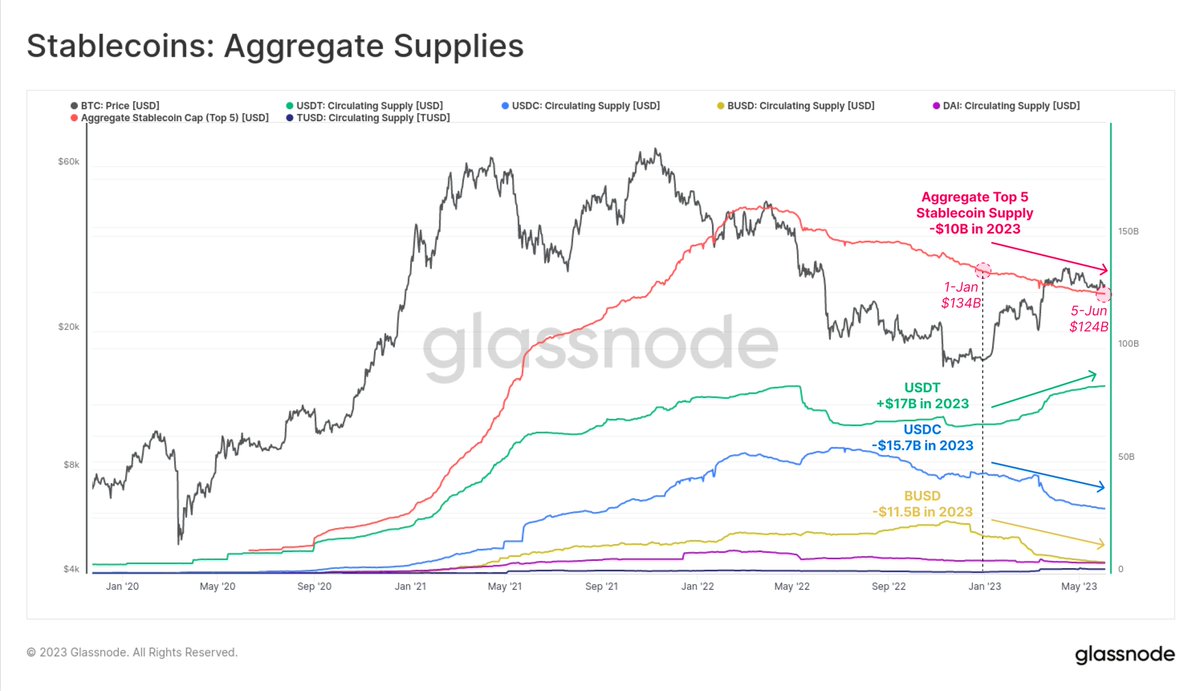
 On May 15th, LidoDAO successfully passed a governance proposal, leading to the launch of Lido V2. This upgrade introduces stake withdrawals and a staking router, a modular infrastructure for validator pools.


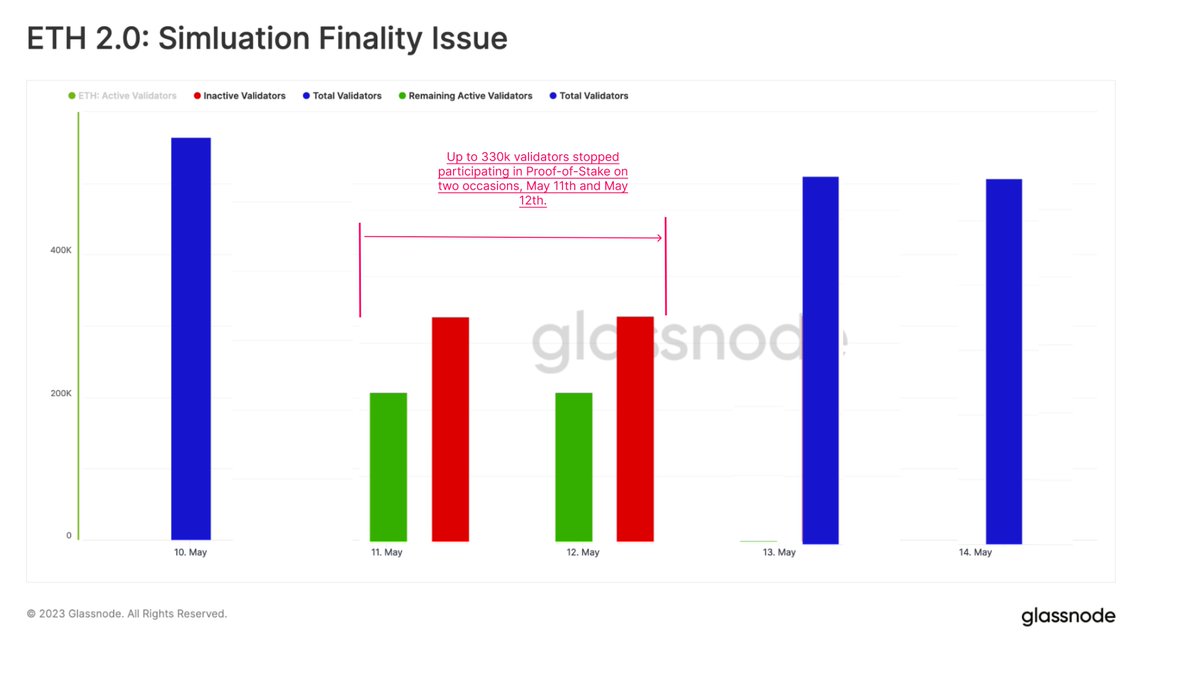 With up to 60% of validators offline and absent in consensus responsibilities, the performance of the chain was degraded. About 3.68% of daily slots were missed and 253 blocks not proposed on time. This remains significantly lower than the 658 blocks missed across the Shapella… twitter.com/i/web/status/1…

 We start with our #Bitcoin mempool, where we see a marked character shift this year.


 The extraordinary trajectory of #Bitcoin requires a log scale to visualize properly
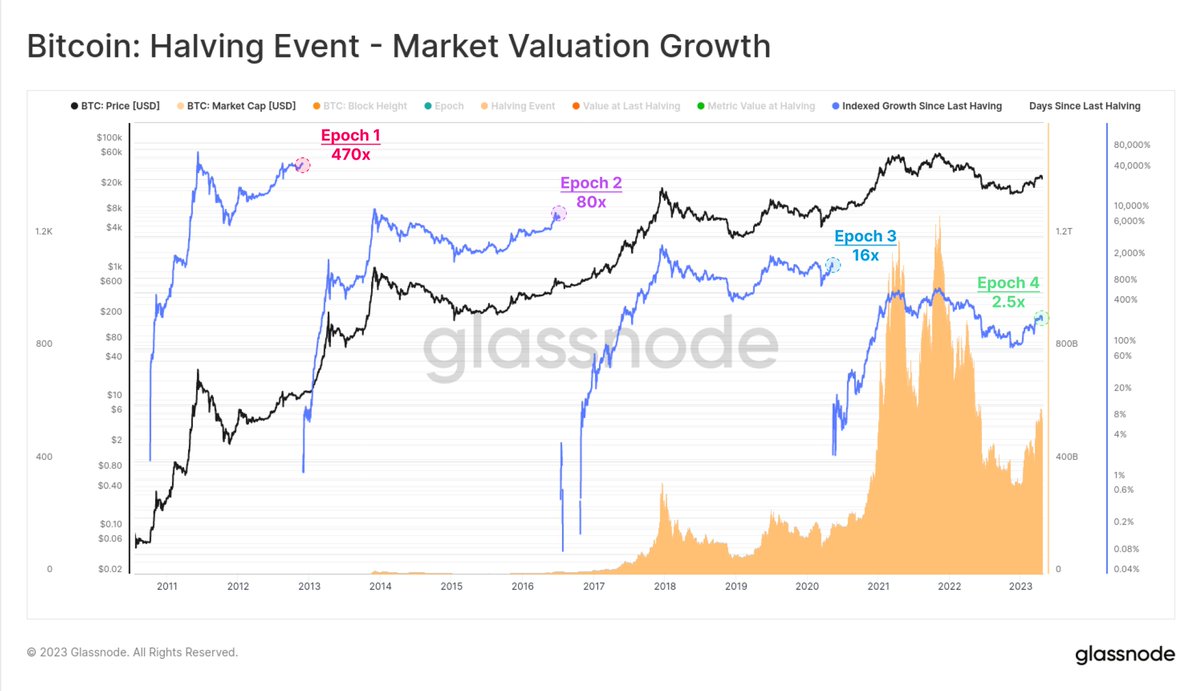


 This has resulted in positive balance changes across all wallet cohorts, from shrimp to whales.
