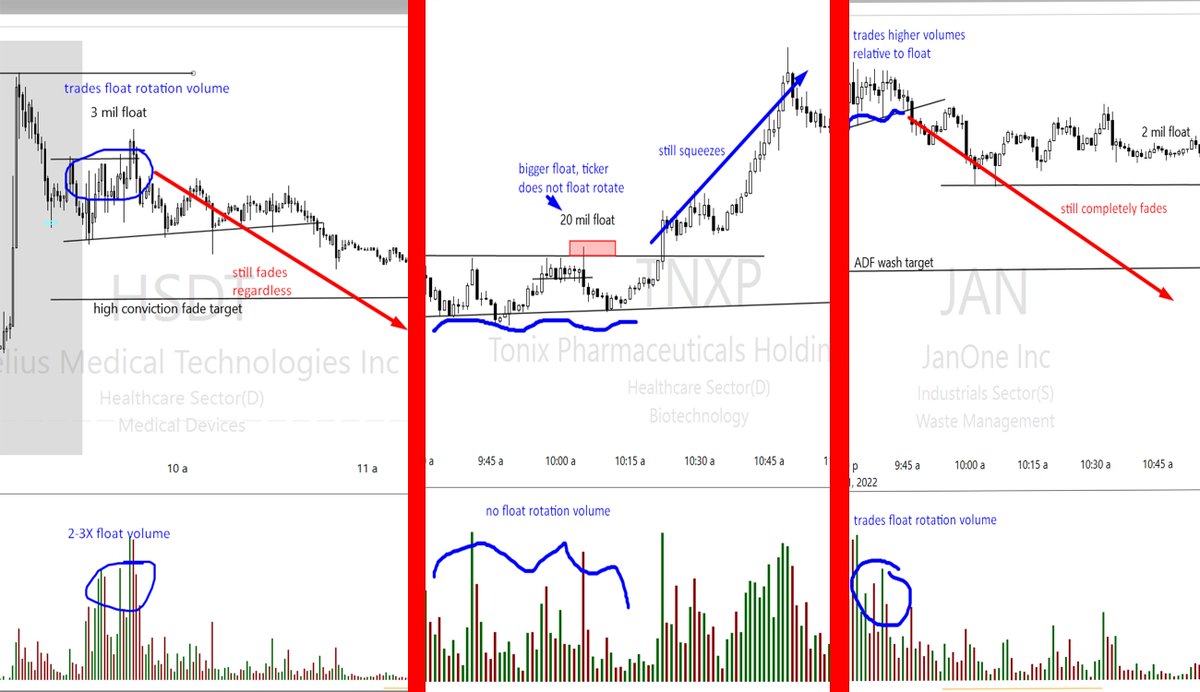
High float rotation volumes as high chance of short squeeze is often overused term, because it is all based on assumption that mechanics work only in one sided direction. Which is incorrect. Market makers can also float rotate somewhat ticker that they are distributing (trap).
Its often very difficult to tell just based from volume and float if ticker is under accumulation or distribution process. So the assumption of low float+high volume=squeeze can also turn very noisy in performance (very much 50-50 guessing).
You need to include recent theme and cycle into the thesis, to increase the probabilities. For example if momentum conditions over past 3 days are really strong, then high volume and float rotation can deliver, but without it, it has actually more chances to fail.
Which tells you that float rotation if not used in right context, is just one of those things to get obsessed with, which doesnt really pack a punch, noisy.
You have to also know when to ignore that variable, which was the case for both HSDT and JAN from personal side.
Also keep in mind, over past 2 years volumes increased by huge factor. So many tickers float rotate vs 2017s for example where it was more rare. Do many more tickers end being squeezers therefore lately too vs 2017 (by factor of 10X)? No.
That should validate the points above.
• • •
Missing some Tweet in this thread? You can try to
force a refresh
If you are looking to collect some data for #smallcaps or #trading in general, or following someone elses advice and their research here are some tips and mistakes to avoid. The biggest problem is most data is noisy (unconclusive) and there are good reasons why, thread:
To collect useful data (not noisy) you need solid critical thinking+skepticism+hard work. This means breaking many ideas back down and rebuilding them from new approach, over and over. A lot of determination and testing before one good idea is shaped and passes test.
Shortcut mentality in fin markets of many will lead to the fact that much of hard work will end up being posted even if author realizes the data is weak, unconclusive (no edge).
Because people want to be given a nod for their time dedication.
Realize how important that might be.
Unlike many other markets not many track PA patterns in #smallcaps or specific behaviors. Mostly due to lack of intraday candles or classic chart patterns. But that doesn't mean there aren't any one just has to look outside of box from traditional chart patterns. #trading
For example, give #crypto guy a drawing board and chart and he'll draw you next Mona Lisa on chart. It's mostly due to abundance of data /candles which makes everyone see what they want to. In scarce environment of smallcaps you have to be more defined as behavior is constricted.
This means that due to time constraint also the MMs will be more forced to use patterns and techniques that also address this problem, not just chart drawers or pattern seekers themselves. It's why there is more liquidity traps in this market on avg due to limited exit opps.
An important research component should be to do your due diligence on how strong your countries #SupplyChain are in case if fuel, food, materials increase by large degree. There are many places (EMs) that require careful planning for next year's and I don't say this lightly.
The seriousness of this situation is it's not isolated pressure, supply chains are under attack from every angle. This will likely lead to weaker countries being excluded out at some point due to prioritization. But issue is, every country is weak at something.
But energy insecurity is probably the main issue because without this the rest of supply chain cannot be secured. But what as well matters is to look into place (s?) that are the most wholistic in having enough self sufficiency as those countries will out-wait the rest.
Fbo/clearout distance is the price that they swipe above HOD. Often same ticker will have similar pattern of distance and can be key guide for short entry accuracy, if it already swiped once with fbo and reject. Important micro behavior to track. #smallcaps
Rough guide is in strong cycle that distance can be large and very open-ended. In weaker cycles and flows it will be more limited. Previous past 10 tickers will also be key guide to tell you current avg cent distance of fbo move to help define that better so track it closely.
Typically before each new fbo HOD swipe, MMs will consolidate price minimum 15 minutes under it. The weaker the flows the longer, and vice versa if stronger. That helps to give you readiness on when it might happen very roughly plus minus 10 min usually.
"Shh, no cheering, trade either works or it doesn't."
My usual default (70%), neutralizing subjectivity and removing internal voice works great on improving discipline and sticking to plan.
"What?! No way!"
This internal voice is dangerous, it gets you bagged on position. Angry surprising reaction due to counter move is often cascaded into bigger than planned loss. Take control quickly when this voice starts to speak.
If doing daily report cards make sure you honestly are seeking specific weaknesses or strengths to improve on and not just placing a dent on that end of day P/L. Make sure journaling approach has proper structure and is not just green/red type of thing. #trading
First thing in journaling to do is to separate setups so that you can track difference of your performance per each setup as likely you'll be performing much better on ones vs others. Journaling system without pattern or setup segregation is already in a bad shape from get go.
The next should be using cycle or market strength as filter variable for your journaling. Over while you might notice that your performance is much better or worse in specific cycle. Then you'll need to dig deep and expand journaling to find out why, by adding more variables.