
With all the current talk about "DCA during this bear market into your favorite blue chip" , I thought it may be time to talk about the mistake that is made by nearly EVERY influencer. BUYING DOWNTRENDS.
A thread discussing uptrends/downtrends, and when to "DCA" . $BTC🧵👇
A thread discussing uptrends/downtrends, and when to "DCA" . $BTC🧵👇

2/
in order to understand WHEN to buy, you must first know which direction the asset is going in...UP or DOWN. we ONLY buy uptrends...why? Well, if you buy downtrends, you are LIKELY to lose money immediatley, since the value is going down nearly daily. $BTC is down 70% 👇
in order to understand WHEN to buy, you must first know which direction the asset is going in...UP or DOWN. we ONLY buy uptrends...why? Well, if you buy downtrends, you are LIKELY to lose money immediatley, since the value is going down nearly daily. $BTC is down 70% 👇

3/ so, lets first identify WHAT an uptrend is. There are only 2 trends - uptrend or downtrend. each are defined by 2 things. for an uptrend you need a Higher high, and a higher low . below is an example of an uptrend for $BTC. higher Highs (HH) and higher lows (HL). We DCA this.

4/ the green vertical lines represent us buying - with cash - each month on the 1st. 12 buys, all going up in value. $200 each time, that's $2400. PLUS our value increases each time. we are winning. $2400 turns into roughly $60k. You're a crypto pro! right Welp...things change👇

5/ now we start seeing Lower highs (LH) and lower lows (LL) which is a DOWNTREND. time for us to DCA, right? So, lets buy buy buy the DIP! "You're getting a discount" influencers often say. Lets do the math. one buy a month, you add $600 and lose 50% of your value. now $30,600😬

6/ but wait! we're back!!! more uptrend! we add 4 more buys, and increase vale another 10%...now we have $67k! LAMBO SEWN. who needs a financial advisor? CHARTS ARE DUMB!!! ASTROLOGY FOR MEN!

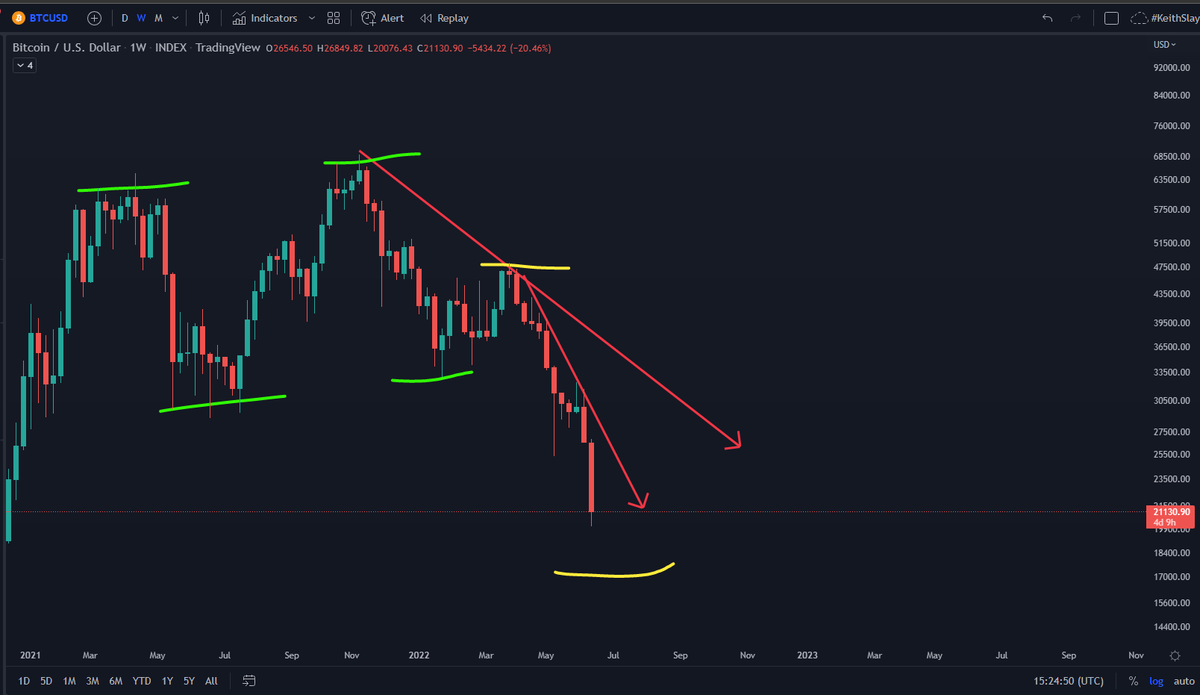
7/ then...it happens. the BIG downtrend starts. i dont need to mark in in the chart, you can see how the lower highs line up.
you never got a SINGLE DOLLAR of profits, and put in ANOTHER 7 buys ($1400) ...nothing to show for your money, which BTW is down 70% now...($21,500)
you never got a SINGLE DOLLAR of profits, and put in ANOTHER 7 buys ($1400) ...nothing to show for your money, which BTW is down 70% now...($21,500)

8/
$21k is nothing to be sad about... but is it $70k ? which one would you RATHER have? wouldn't you like to have $70 worth of #USDC ready to buy BTC at the bottom? last time you had a small fraction of that. where's the bottom? well, weekly says the knife is still falling
$21k is nothing to be sad about... but is it $70k ? which one would you RATHER have? wouldn't you like to have $70 worth of #USDC ready to buy BTC at the bottom? last time you had a small fraction of that. where's the bottom? well, weekly says the knife is still falling
9/
IF this were the bottom(its not), and previous ATH gets hit (likely for BTC), you've now made $150,000 with your $67k, and added NO NEW MONEY. No need as you have stables to deploy. If you DCA and it took a year, you'd be at $69k. you make DOUBLE by selling the downtrend😬
IF this were the bottom(its not), and previous ATH gets hit (likely for BTC), you've now made $150,000 with your $67k, and added NO NEW MONEY. No need as you have stables to deploy. If you DCA and it took a year, you'd be at $69k. you make DOUBLE by selling the downtrend😬

10/
still thinking - "But I don't wanna stop buying, I can afford it, I'm a long term investor". GOOD. now, instead of buying BTC or ANYTHING that drops in value in a downtrend, buy $USDC or your fav stable coin. when you get a buy signal, deploy your stables. below 8 USDC buys.
still thinking - "But I don't wanna stop buying, I can afford it, I'm a long term investor". GOOD. now, instead of buying BTC or ANYTHING that drops in value in a downtrend, buy $USDC or your fav stable coin. when you get a buy signal, deploy your stables. below 8 USDC buys.

11/ you now have an extra $1600 SO FAR in $USDC to buy with, and a downward 8/21 EMA cross, so you sold the $BTC you have , and the moment you get a buy signal You'll have MORE $ to increase your position EVEN MORE. TA gets you more $, and saves you on the way down EVEN LONG TERM

12/ this is just a simple and quick breakdown of WHEN to DCA and when NOT to DCA into an asset. start on the weekly chart, and work your way down. reduce risk and exposure, make more $, and ACTUALLY take profits! Our discord talks about this 10ll the time, check us out! 👇
13/ like minded peeps, working together to develop a better strategy than the rest. TA for the masses, one person at a time. General chat is free, and fully unlocks with Patreon membership! discord.gg/rSugr4FuuK
14/ patreon.com/CarolinaKeith?… here's the patreon link! $16 gets you full access, pay for a year and get 10% off! we have charts of all different types, THOUSANDS worth or educational material, and it pays for itself in no time! SEE ya'll there!
END 🧵
END 🧵
• • •
Missing some Tweet in this thread? You can try to
force a refresh


