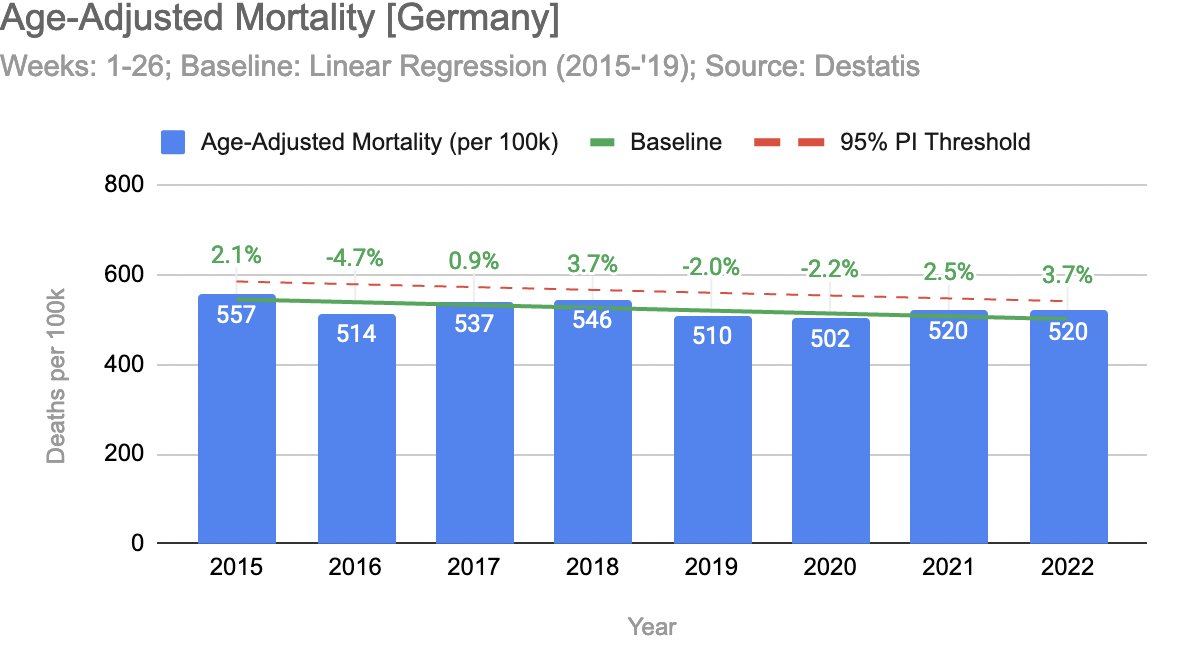
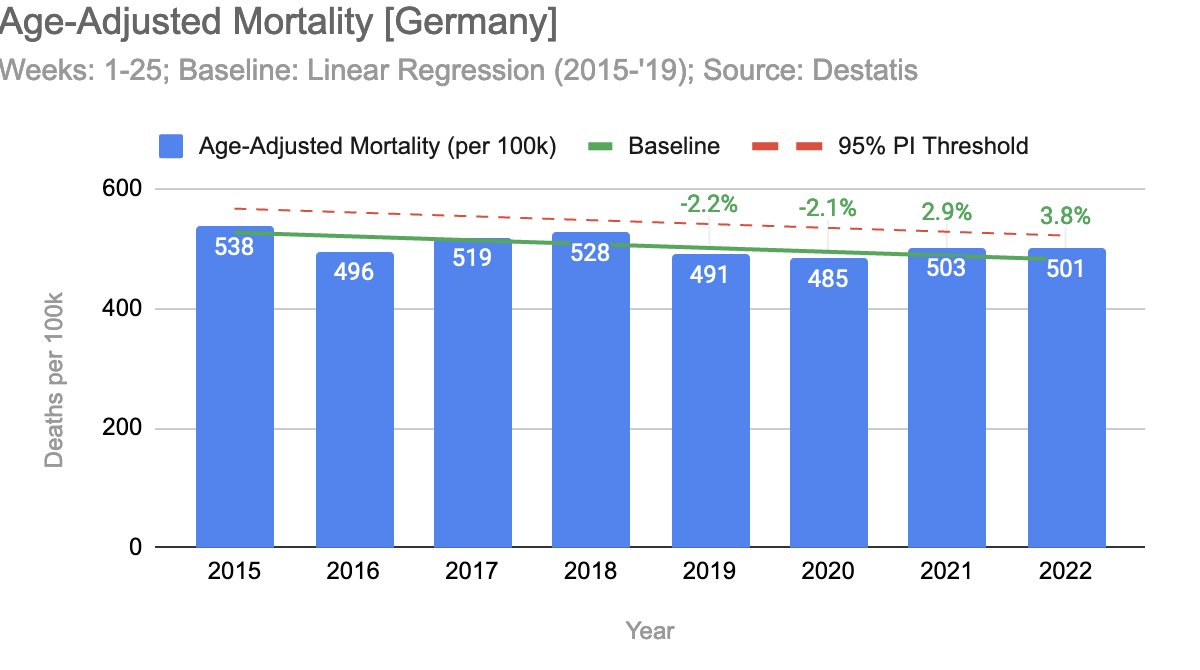
Weekly Germany All-Cause Mortality Update!
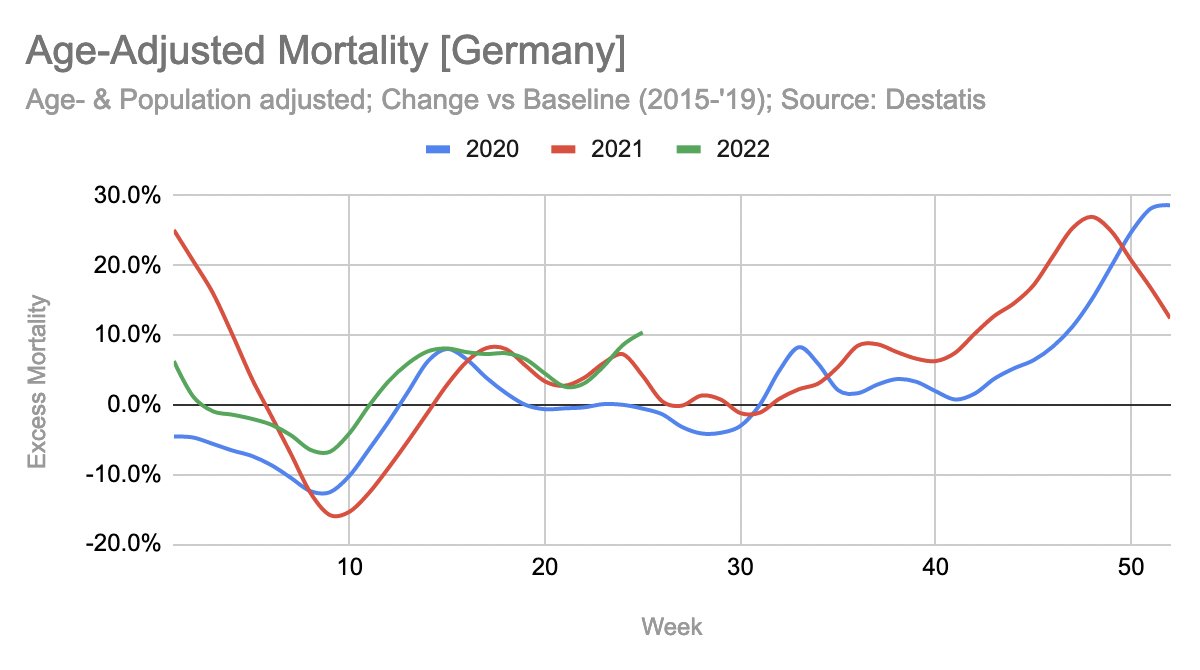
> YTD, same mortality as last year, but higher excess, due to decreasing baseline.
> There's also significantly less deaths in <30, which is strange, and could be caused by reporting delay.. #Covid#Covid19#Corona#Coronavirus
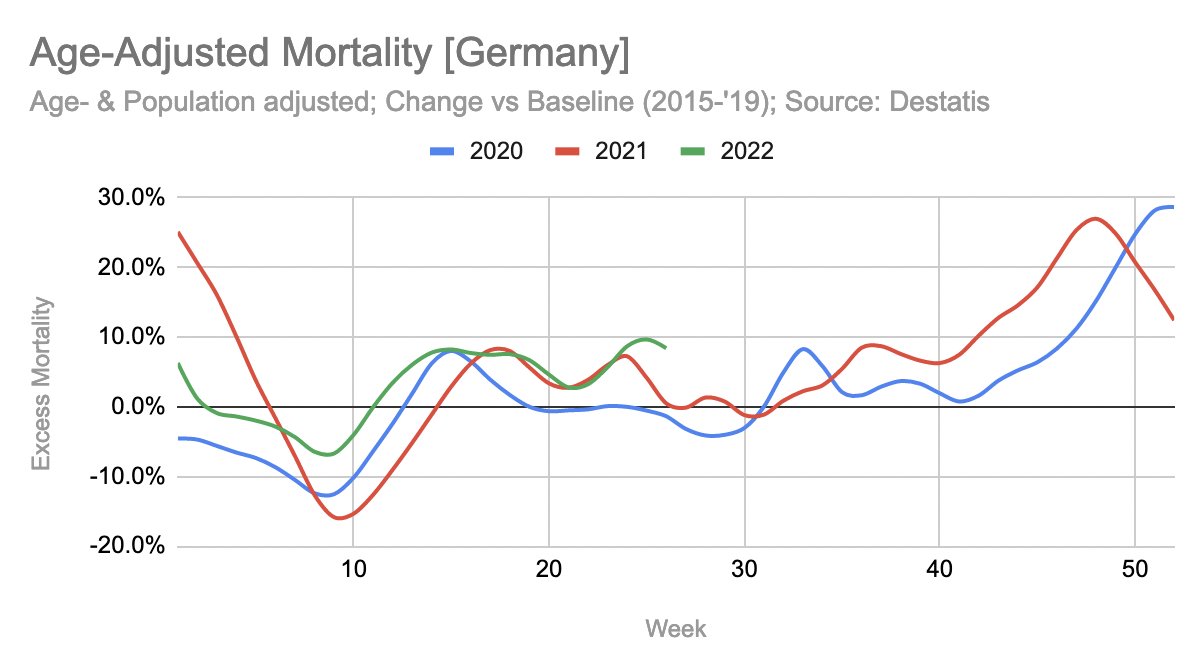
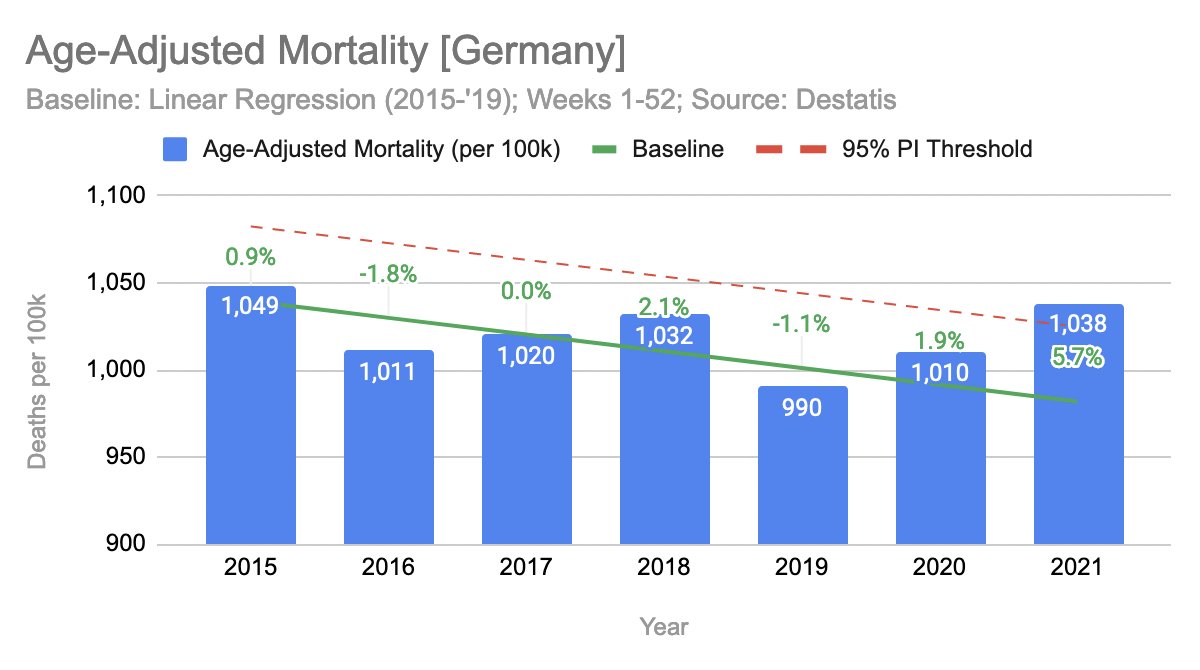
the latest quarter had the highest mortality since 2015, with excess of +7.4%.
Totgeburten in 2021 steigen auf Rekordhoch in Deutschland!
> Im Jahr 2021 + 11.1% mehr Totgeburten, als noch im 3 Jahresdurchschnitt vor der Pandemie.
> Im ersten Pandemiejahr 2020 liegen die Zahlen allerdings auch im normalen Bereich und sogar unter dem Niveau von 2019!
Und nein, diese Veränderung ist wohl nicht durch eine Zunahme von Schwangerschaften zu erklären, da die Lebendgeurten nur ca 1,2% über dem Durchschnitt lagen:
Governments around the world, still don't want to give up their COVID powers.
Currently world stringency is at 31%, maximum was at 81%.
2020 had an average of 52%, 2021 53% and 2022 so far 38%...
Complete all-cause mortality data for Q2/2022 for Germany shows highest mortality since 2015.
> Excess Mortality at +7.2% for that quarter.
> That is +4.7% higher than in the first pandemic quarter in 2020. #Covid#Covid19#Corona#Coronavirus
Year-to-date: Also highest excess in the pandemic so far, though on par with last year, in absolute numbers.
Latest week +8.2% excess (heat wave), but higher than two previous years!
First of all, this is based on a model - We know how well models work by now!
Secondly, they've configured their model, so that from the day the vaccines were available, all factors in their model remain the same. Here I infer, that mainly they are referring to CFR.
CFR, stands for Case Fatality Rate and is calculated as shown below.
Here comes the error the authors make. CFR is not stable. It changes massively over time. Both the numerator and the denominator might be influenced by several factors.
Weekly Age-Adjusted All-Cause Mortality Update [Germany]!
> Year to date: In absolute terms, similar like last year, but higher than 2020.
> Accounting for linear baseline trend: +3.8% excess. #Covid#Covid19#Corona#Coronavirus
Reminder full years:
Here it depends how we define the baseline. If defined with a downtrend (lin.reg.) as WHO/Euromomo does it, we get +5.7% excess in 2021.
Timeline: Last week stands out with +10.4% excess!