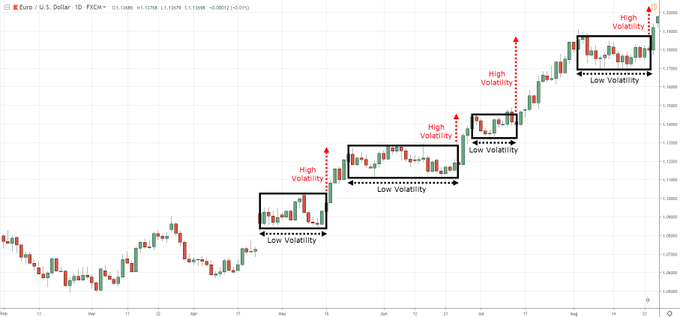
In Technical Analysis, a candlestick pattern is a movement in prices shown graphically on a candlestick chart that some believe can predict a particular market movement.
thread 🧵 👇by @Stocktwit_IN
thread 🧵 👇by @Stocktwit_IN
History:
Some of the earliest technical trading analysis was used to track prices of rice in the 18th century. Much of the credit for candlestick charting goes to Munehisa Homma (1724–1803), a rice merchant from Sakata, Japan who traded in the Ojima Rice market in Osaka
Some of the earliest technical trading analysis was used to track prices of rice in the 18th century. Much of the credit for candlestick charting goes to Munehisa Homma (1724–1803), a rice merchant from Sakata, Japan who traded in the Ojima Rice market in Osaka
Formation of the candlestick:
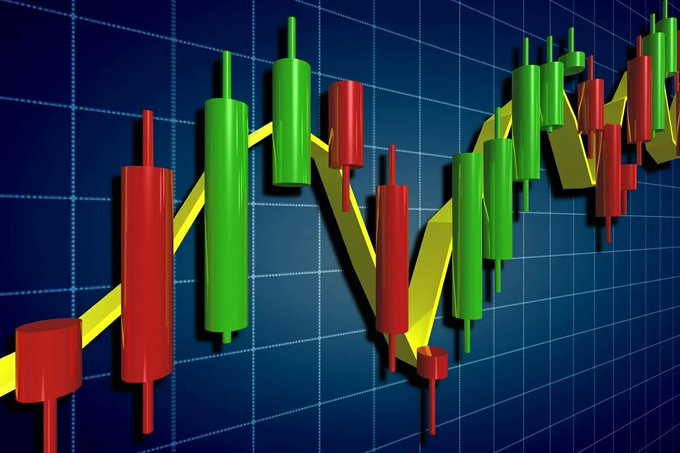
Candlesticks are graphical representations of price movements for a given period of time. They are commonly formed by the opening, high, low, and closing prices of a financial instrument.
Candlesticks are graphical representations of price movements for a given period of time. They are commonly formed by the opening, high, low, and closing prices of a financial instrument.
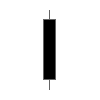
Big Black Candle Has an unusually long black body with a wide range between high and low. Prices open near the high and close near the low. Considered a bearish pattern.
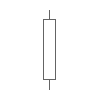
Big White Candle Has an unusually long white body with a wide range between high and low of the day. Prices open near the low and close near the high. Considered a bullish pattern.
Black Body Formed when the opening price is higher than the closing price. Considered to be a bearish signal.
White Body Formed when the closing price is higher than the opening price and considered a bullish signal.
White Body Formed when the closing price is higher than the opening price and considered a bullish signal.
Doji Formed when opening and closing prices are virtually the same. The lengths of shadows can vary. If previous are bearish, after a Doji, may be ready to bullish.
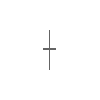
Long-Legged Doji Consists of a Doji with very long upper and lower shadows. Indicates strong forces balanced in opposition. If previous are bullish, after long legged doji, may be ready to bearish.

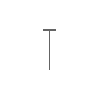
Dragonfly Doji Formed when the opening and the closing prices are at the highest of the day. If it has a longer lower shadow it signals a more bullish trend. When appearing at market bottoms it is considered to be a reversal signal.
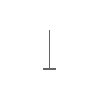
Gravestone Doji Formed when the opening and closing prices are at the lowest of the day. If it has a longer upper shadow it signals a bearish trend. When it appears at market top it is considered a reversal signal.
learn more about Candlestick patterns
en.wikipedia.org/wiki/Candlesti…
#Nifty #sensex
#StockMarket
@rattibha
@threadreaderapp
@UnrollHelper
en.wikipedia.org/wiki/Candlesti…
#Nifty #sensex
#StockMarket
@rattibha
@threadreaderapp
@UnrollHelper
• • •
Missing some Tweet in this thread? You can try to
force a refresh