1 // #Bitcoin Bottom Signals 🚀🔥
In just a few months, #Bitcoin traded $70000 all the way down to $20000. A historical drawdawn, the right time to look at potential bottom signals
I'll move over several datapoints. The more you'll see, the more bottom-ish. Let's go 👇
In just a few months, #Bitcoin traded $70000 all the way down to $20000. A historical drawdawn, the right time to look at potential bottom signals
I'll move over several datapoints. The more you'll see, the more bottom-ish. Let's go 👇
1 // Exchange Reserve. Reserves are trending down 🟢
Less #Bitcoin on exchanges = Less potential selling pressure
Chart:
cryptoquant.com/asset/btc/char…

Less #Bitcoin on exchanges = Less potential selling pressure
Chart:
cryptoquant.com/asset/btc/char…


2 // Drawndown from ATH 🟠
Previous Bear Markets: at least 80%
Current Bear Market: 70%
Chart:
studio.glassnode.com/metrics?a=BTC&…
Previous Bear Markets: at least 80%
Current Bear Market: 70%
Chart:
studio.glassnode.com/metrics?a=BTC&…

3 // Net Unrealized Loss (NUL) 🟢
Unrealized Losses equal as COVID-19 Crash. Not as high as previous bear markets 😉
cryptoquant.com/asset/btc/char…
Unrealized Losses equal as COVID-19 Crash. Not as high as previous bear markets 😉
cryptoquant.com/asset/btc/char…

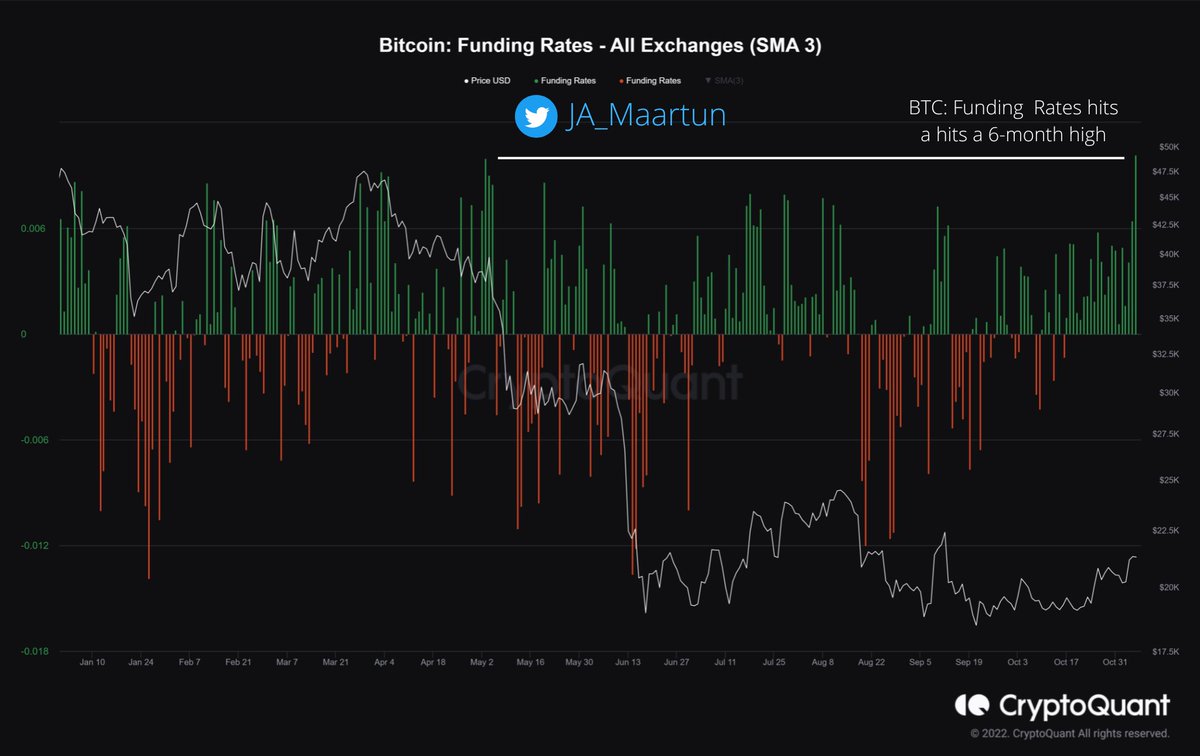
4 // Negative Funding Rates 🟢
Bitcoin likes to bottom on negative funding rates
Chart:
cryptoquant.com/asset/btc/char…
Bitcoin likes to bottom on negative funding rates
Chart:
cryptoquant.com/asset/btc/char…

5 // Net Unrealized Profit/Loss (NUPL) 🟢
Blue color (🔵) = Capitulation
Chart:
cryptoquant.com/asset/btc/char…
Blue color (🔵) = Capitulation
Chart:
cryptoquant.com/asset/btc/char…

6 // Bitcoin: UTXOs in Loss 🟢
Above previous bear market levels
Chart:
cryptoquant.com/asset/btc/char…
Above previous bear market levels
Chart:
cryptoquant.com/asset/btc/char…

7 // #Bitcoin MVRV Ratio is below 1 🟢
MVRV Ratio = Market Cap / Realized Cap
By comparing two valuation methods, the MVRV ratio can tell us to get a sense of whether the price is fair or not, which means it is useful to get market tops and bottoms.
MVRV Ratio = Market Cap / Realized Cap
By comparing two valuation methods, the MVRV ratio can tell us to get a sense of whether the price is fair or not, which means it is useful to get market tops and bottoms.

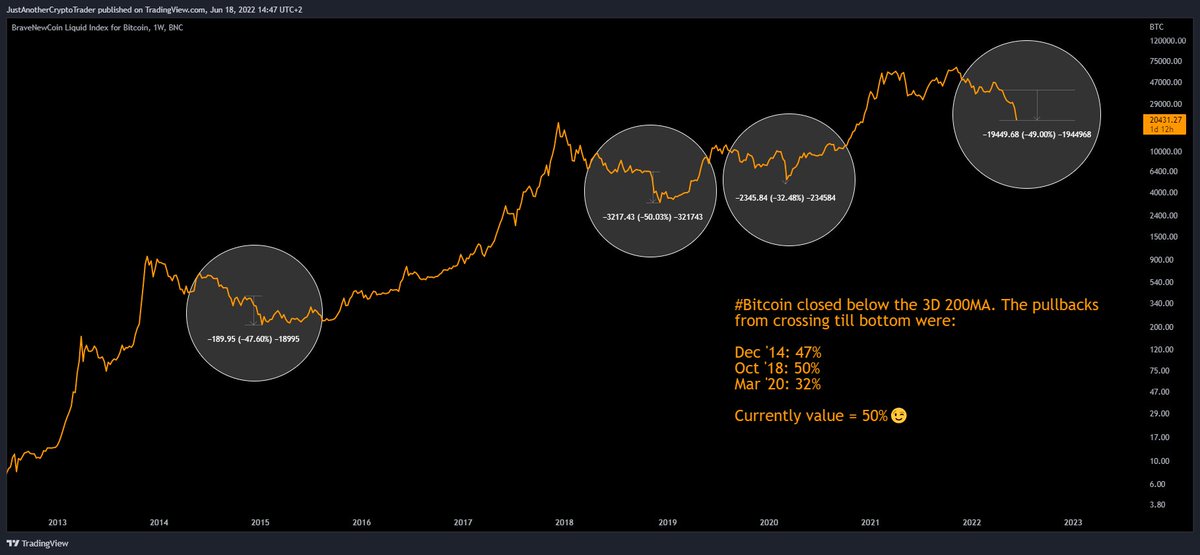
8 // Pullback from 3D 200MA 🟢
#Bitcoin closed below the 3D 200MA. The pullbacks
from crossing till bottom were:
Dec '14: 47%
Oct '18: 50%
Mar '20: 32%
Currently value = 50%😉
#Bitcoin closed below the 3D 200MA. The pullbacks
from crossing till bottom were:
Dec '14: 47%
Oct '18: 50%
Mar '20: 32%
Currently value = 50%😉

9 // 200 Weekly Moving Average 🟢
Historically, #Bitcoin hasn't spent much time below 200 WMA. Currently trading below it😉
Historically, #Bitcoin hasn't spent much time below 200 WMA. Currently trading below it😉

X / / And plenty more, but I had the feeling I should release this thread soon. It's not complete, but don't want to hold this information by meself. Make sure to use it!
15 // Bitcoin: Exchange Inflow (Mean, MA7)
1. $BTC drops hard over -30%
2. All Exchange Inflow Mean (MA7) spikes over 2.5 BTC
3. The indicator cools down
4. ALL-IN $BTC
cryptoquant.com/asset/btc/char…
1. $BTC drops hard over -30%
2. All Exchange Inflow Mean (MA7) spikes over 2.5 BTC
3. The indicator cools down
4. ALL-IN $BTC
cryptoquant.com/asset/btc/char…

16 // Thick white support clusters below price. #FireCharts could help
https://twitter.com/MI_Algos/status/1566232094598201348
17 // DonAlt buying 🫢
https://twitter.com/CryptoDonAlt/status/1592943507018113024?t=sMu5cqiJ4KtRkSxeddyMeg&s=19
18 // Time duration from ATH ⏰
https://twitter.com/JA_Maartun/status/1600060264430256128?t=UUqg1i-iBMkLxcmCI1NOTA&s=19
• • •
Missing some Tweet in this thread? You can try to
force a refresh


