Shiny is a powerful tool that data scientists can use for web apps & production.

But most data scientists struggle.

Here are 7 resources on shiny that helped me.

#rstats #shiny #excel #python
1. The Shiny website

The 1st place to go to learn shiny.

shiny.rstudio.com
2. Flexdashboard website

Flexdashboard combines Rmarkdown & Shiny to make quick apps.

pkgs.rstudio.com/flexdashboard/
3. Shiny Widgets gallery

See dozens of example reactive widget input / outputs for shiny

shiny.rstudio.com/gallery/widget…
4. shinyWidgets by dreamrs

Advanced & customizable reactive widgets that can really take your shiny apps to the next level

dreamrs.github.io/shinyWidgets/i…
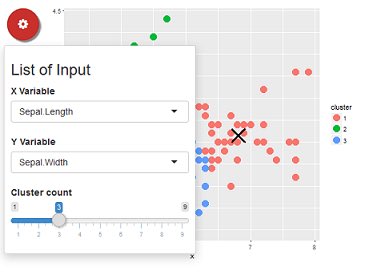
5. HTML Widgets

Interactive visuals for shiny apps

htmlwidgets.org/showcase_leafl…
6. Shiny JS

Makes it easy to add JavaScript actions to your shiny apps.

deanattali.com/shinyjs/
7. Bslib

Upgrade shiny From Bootstrap 3 to 4 or 5 and makes it easy to make custom themes.

rstudio.github.io/bslib/
And if you want all of these 7 R packages plus 93 more in one consolidated #cheatsheet, download my ultimate #R cheat sheet.

business-science.io/r-cheatsheet.h…
One last resource.

If you've been struggling to learn R, I’d like to help.

I put together a free R webinar that consolidates the 10 secrets that helped me in my career.

learn.business-science.io/free-rtrack-ma…

• • •

Missing some Tweet in this thread? You can try to force a refresh
 

Keep Current with Matt Dancho (Business Science)

Matt Dancho (Business Science) Profile picture

Stay in touch and get notified when new unrolls are available from this author!

Read all threads

This Thread may be Removed Anytime!

PDF

Twitter may remove this content at anytime! Save it as PDF for later use!

Try unrolling a thread yourself!

how to unroll video
  1. Follow @ThreadReaderApp to mention us!

  2. From a Twitter thread mention us with a keyword "unroll"
@threadreaderapp unroll

Practice here first or read more on our help page!

More from @mdancho84

Sep 14
TODAY. I'm excited to share 2 years of research + 6 software packages that went into Time Series Analysis...

And it's not what you think... 🧵

#rstats #datascience #timeseries #python #excel Image
I won't be talking about ARIMA.

Or, focusing on stationarity.
And, I most certainly will NOT be talking about:

1. Prophet

2. Exponential smoothing

3. Holt winters

4. Time series decomposition

5. OR any other "common techniques"
Read 5 tweets
Sep 14
When it comes to Time Series, colleges and universities have it all wrong.

A time series thread 🧵

#rstats #excel #python #timeseries
Universities are stuck in the past, teaching ARIMA.

But the cold reality is that ARIMA is NOT winning time series competitions & ARIMA is NOT helping companies solve BIG forecasting problems.
To be frank, ARIMA is too slow.

When you use ARIMA, you fall into a trap. You think, hey, this is what they're teaching me...

It must be good, right?
Read 12 tweets
Sep 12
Time series analysis is getting...

EASIER!

Here's a quick thread. 🧵

#rstats #excel #python #timeseries
Time series analysis is getting EASIER!

New tools are being developed...
1. #Timetk for time series data wrangling + data viz

Think if this little gold nugget like dplyr + ggplot2 for time series.

Yep, you can slice & dice that time series.

And, get quick visuals that make your boss cry tears of joy 🥲
Read 9 tweets
Sep 11
The most important skill in time series analysis isn’t forecasting.

It’s visualization.

Here's why in this thread. 🧵

#datascience #rstats #excel #timeseries Image
90% of data scientists will model a time series like it’s a machine learning problem.

Apply an algorithm. Tune it. Reduce RMSE.

But I’d argue that visualization will help even more.
Here's how visualization helps.

1. You’ll see the shape of the series.

2. You’ll gain context for the business scenario.

3. And you’ll be able to see whether or not a forecast makes sense.
Read 7 tweets
Sep 4
Learning #timeseries can be tough.

Here are the 7 #R packages that have helped me learn time series and improve my forecasts.

#rstats
1. #timetk time series data wrangling + visualization

github.com/business-scien…
2. #modeltime time series forecasting

github.com/business-scien…
Read 10 tweets
Sep 3
Starting out in #R can be tough.

Here are the 7 packages that have helped me tremendously.

#rstats
1. #dplyr for data wrangling

github.com/tidyverse/dplyr
2. #tidyr for tidying, wrangling and pivoting

github.com/tidyverse/tidyr
Read 10 tweets

Did Thread Reader help you today?

Support us! We are indie developers!


This site is made by just two indie developers on a laptop doing marketing, support and development! Read more about the story.

Become a Premium Member ($3/month or $30/year) and get exclusive features!

Become Premium

Don't want to be a Premium member but still want to support us?

Make a small donation by buying us coffee ($5) or help with server cost ($10)

Donate via Paypal

Or Donate anonymously using crypto!

Ethereum

0xfe58350B80634f60Fa6Dc149a72b4DFbc17D341E copy

Bitcoin

3ATGMxNzCUFzxpMCHL5sWSt4DVtS8UqXpi copy

Thank you for your support!

Follow Us on Twitter!

:(