
When I first learned R, I struggled making data visualizations with ggplot2.
Here are the 3 things that helped me.
#rstats #R #datascience #datavisualization
Here are the 3 things that helped me.
#rstats #R #datascience #datavisualization
Data visualizations are absolutely the most important thing to learn because of story telling...
... the ability to help your business take action.
AND the most powerful R library for static data visualization is ggplot2.
... the ability to help your business take action.
AND the most powerful R library for static data visualization is ggplot2.
But ggplot2 has a STEEP learning curve.
3 things that helped me...
3 things that helped me...
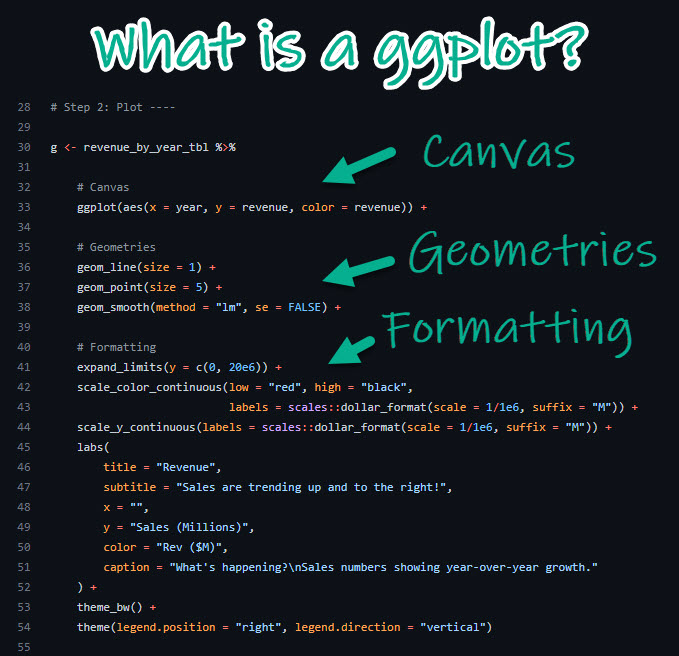
1. The Canvas
Just like a painter starts with a blank canvas, so does the data scientist when making a plot.
Just like a painter starts with a blank canvas, so does the data scientist when making a plot.
KEY CONCEPT.
The canvas connects our columns in our data frame to parts of our canvas.
X and Y axis maps columns to the plot.
Color maps a column that acts as a color gradient in this case.
The canvas connects our columns in our data frame to parts of our canvas.
X and Y axis maps columns to the plot.
Color maps a column that acts as a color gradient in this case.
2. Geometries
Geometries are the structure that forms lines, points, smoothers, and so on.
Geometries are the structure that forms lines, points, smoothers, and so on.
KEY CONCEPT.
Each geom_ function applies a geometry building your plot in layers.
As you progressively add more geometries (scatter points, lines, smoothers)...
...You build your plot up in layers.
This makes it easy to go from a simple plot to very sophisticated quickly.
Each geom_ function applies a geometry building your plot in layers.
As you progressively add more geometries (scatter points, lines, smoothers)...
...You build your plot up in layers.
This makes it easy to go from a simple plot to very sophisticated quickly.
3. Formatting
Formatting is one of the toughest parts because there are so many options.
Formatting is one of the toughest parts because there are so many options.
PRO-TIP.
Don't try to learn everything.
Just learn the most common options.
Here are the most common options I use...
Don't try to learn everything.
Just learn the most common options.
Here are the most common options I use...
My most common formatting options:
- Expanding limits
- Applying scales to adjust colors and how the axis labels appear
- Adding labs for title, subtitle, and so on
- Adjust the theme for professional quality plots
- Expanding limits
- Applying scales to adjust colors and how the axis labels appear
- Adding labs for title, subtitle, and so on
- Adjust the theme for professional quality plots
SUPER IMPORTANT POINT
If you are just starting out learning R for business analytics, it takes time...
... You aren't going to become a PRO overnight.
BUT, you need a roadmap, and that's what I can help you with.
If you are just starting out learning R for business analytics, it takes time...
... You aren't going to become a PRO overnight.
BUT, you need a roadmap, and that's what I can help you with.
I've put together a FREE 40-minute webinar that shows you the 10 skills in R that helped me become a data scientist.
And, if I was starting again, this training would have easily shaved 6-months to 1-year off of my 5-year journey.
Free R Webinar: learn.business-science.io/free-rtrack-ma…
And, if I was starting again, this training would have easily shaved 6-months to 1-year off of my 5-year journey.
Free R Webinar: learn.business-science.io/free-rtrack-ma…

Here's the ggplot visualization from the code...

And if you want more R-Tips, you can join my R-Tips newlsetter here. learn.business-science.io/r-tips-newslet…
Just sent this one out today. business-science.io/code-tools/202…
Just sent this one out today. business-science.io/code-tools/202…

• • •
Missing some Tweet in this thread? You can try to
force a refresh


