Here's my 100 weeks of backtested $EURUSD price action from June 15 2020 to 09 May 2022, here's what is covered:
- Occurrence of high & low of the week
- % of high and low of the week per day
- % of Mondays high / low being swept on a given day
Took me a while, hope you enjoy
- Occurrence of high & low of the week
- % of high and low of the week per day
- % of Mondays high / low being swept on a given day
Took me a while, hope you enjoy

The high and low of the week
Here we can determine that the low of the week fell 38/100 times on a Mon, while the high of the week was also most likely to form on this day too with 31/100 occurrences
Note that there's during the week, there's more of a spread compared to $BTC
Here we can determine that the low of the week fell 38/100 times on a Mon, while the high of the week was also most likely to form on this day too with 31/100 occurrences
Note that there's during the week, there's more of a spread compared to $BTC

Percentage / Chance wise, you can see that Monday is more likely to be the low of the week by a factor of 5, 2, and 3 compared to a T, W, or Th respectively
Friday is different though.
With the high of the wk, Monday leads, followed by a Thurs, then Friday.
Friday is different though.
With the high of the wk, Monday leads, followed by a Thurs, then Friday.

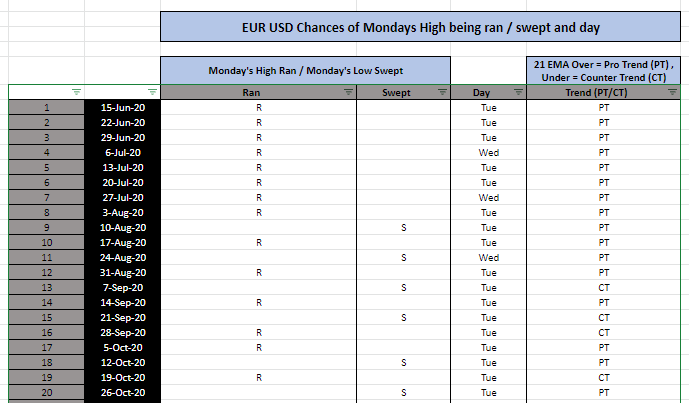
We can then use this data to assess the day & trend that Mondays high or low is ran
What I did in my testing was use an 'R' for high ran, & an 'S' for low swept
I also noted the given day that this occured, & also used the 21EMA to determine pro trend or counter trend
What I did in my testing was use an 'R' for high ran, & an 'S' for low swept
I also noted the given day that this occured, & also used the 21EMA to determine pro trend or counter trend
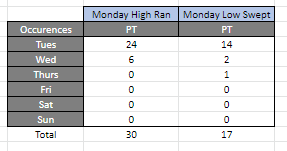
Pro Trend (Price above 21 Daily EMA)
Here you can see the data from a pro trend, & the occurrences of the Fiber running a high, or sweeping a low
There were 47/100 occurrences of a pro trend run / sweep.
Let's take a look at the percentages next
Here you can see the data from a pro trend, & the occurrences of the Fiber running a high, or sweeping a low
There were 47/100 occurrences of a pro trend run / sweep.
Let's take a look at the percentages next
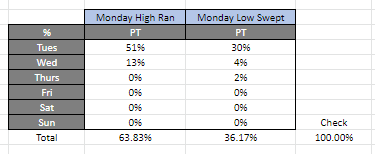
Pro Trend (PT) Chance / %
You can see how important the Monday high or low is compared to the rest of the week as @I_Am_The_ICT & @RektProof fairly point out
From the data, I found that during a Pro Trend, there's a combined 81% of price interacting with the Monday low or high
You can see how important the Monday high or low is compared to the rest of the week as @I_Am_The_ICT & @RektProof fairly point out
From the data, I found that during a Pro Trend, there's a combined 81% of price interacting with the Monday low or high
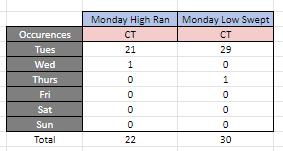
Counter Trend (CT) (Price below 21 Daily EMA)
In a counter trend, there were 52/100 occurrences that were recorded.
It's amazing how often the $EURUSD Monday high or low is ran or swept on a Tuesday
In a counter trend, there were 52/100 occurrences that were recorded.
It's amazing how often the $EURUSD Monday high or low is ran or swept on a Tuesday
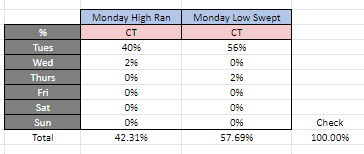
Counter Trend Chance / %
You can see here how important the Monday low or high is in a counter trend, where 96% of the time, price interacted with these key levels.
We've now covered 99/100 occurrences though
You can see here how important the Monday low or high is in a counter trend, where 96% of the time, price interacted with these key levels.
We've now covered 99/100 occurrences though
Inside Weeks:
There was only 1 week out of 100 where the Monday high or low was not ran or swept. This was:
- Week Commencing 21 Dec 2020
The only assumption made here is that there could have been low volumes based on a pandemic stricken holiday perod, but this is speculation
There was only 1 week out of 100 where the Monday high or low was not ran or swept. This was:
- Week Commencing 21 Dec 2020
The only assumption made here is that there could have been low volumes based on a pandemic stricken holiday perod, but this is speculation
Similar to my $BTC 100 Week backtesting, this took me 8 or so hours to compile on a rainy day back in May, but it goes to show how valuable it is.
I'm also happy to share this data with you, found here with everything I share (green highlighted one)
bit.ly/3uM7POn
I'm also happy to share this data with you, found here with everything I share (green highlighted one)
bit.ly/3uM7POn
For those of you who may be interested in the $BTC / #bitcoin or #crypto version of this I did, please see below
https://twitter.com/Mindset_BTC/status/1558423246797950976?s=20&t=g5OJOmL5k9CwNxmttpJdOg
And if this helped, feel free to swing over to the socials:
Telegram:
t.me/Mindset_BTC
Youtube:
youtube.com/c/MindJacked
Discord:
discord.gg/yFdcmbd8yt
Thanks everyone
Telegram:
t.me/Mindset_BTC
Youtube:
youtube.com/c/MindJacked
Discord:
discord.gg/yFdcmbd8yt
Thanks everyone
Please also note, I'm not a statistician.
I simply made some notes and observations of my own for trading. If you can use them, great, but please do your own checks of your own.
I'm sure there are errors somewhere.
I'm a human after all.
Cheers
I simply made some notes and observations of my own for trading. If you can use them, great, but please do your own checks of your own.
I'm sure there are errors somewhere.
I'm a human after all.
Cheers
• • •
Missing some Tweet in this thread? You can try to
force a refresh