If policymakers misinterpret #inflation numbers and call for drastic tightening of monetary policy in response, an already difficult economic situation could get infinitely worse.
Here’s why this could be a real risk in the coming months.
🧵
1
Here’s why this could be a real risk in the coming months.
🧵
1
The first reason is simple: policymakers need to focus not on current inflation numbers but on rates expected when policy impacts will be felt on the economy, i.e. at least 1 year down the line.
On this see this thread:
2
On this see this thread:
https://twitter.com/AndrewWattEU/status/1571904082478256129?s=20&t=vT4Ct9Gtnb_Dy7Vo__SR3g
2
Here I want to focus on a 2nd, interrelated reason. It’s a tad more complex and so the thread is quite long, but do stick with it: the results are quite striking!
I'm going to use German numbers to illustrate the points, but the same holds broadly for the Euro Area as a whole.
3
I'm going to use German numbers to illustrate the points, but the same holds broadly for the Euro Area as a whole.
3
Let’s start by going back to the “policy lags” argument. A rebuttal might run: But inflation is forecast to be high also in 2023. For 🇩🇪 you could point to the joint forecast (known as “GD”) by 4 leading economic research institutes: 2022 8.4% rising to 8.8% next year.
4
4
“Not only is inflation very high. It is set to increase. Vigorous action is needed!“
That finding is intuitively plausible. But wrong! To see why we need to delve a little into the way inflation is reported and the impact of so-called base effects.
5
That finding is intuitively plausible. But wrong! To see why we need to delve a little into the way inflation is reported and the impact of so-called base effects.
5
The 8.4/8.8% forecasts are annual average changes. A price index shows how much prices have risen each month (since a given starting point). The annual average is the average of the 12 monthly values.
The annual average change is then the % difference between 2 averages.
6
The annual average change is then the % difference between 2 averages.
6
The blue line shows the way the 🇩🇪 index has increased since the start of 2021. The left-hand black bar shows the 2021 average. The middle one shows the expected average for 2022; we have data up to September and have to forecast the other 3 values. The difference is 8.4%.
7
7

Given an annual-average-change forecast of 8.8% for 2023, the average of the 12 monthly index values in 2023 needs to be exactly that much higher than for 2022. In purely mathematical terms, there are many “paths” of the index one can set to generate that outcome (“scenario”).
8
8
But economically (I’ll return to this below) the path is constrained to be broadly like that in the graph: the index steadily flattens. But by how much? And what does it mean? To see that we convert the index into 2 other inflation measures, the annual & the monthly rate.
9
9
The annual rate is the most familiar, the one with the well-known ECB target of 2% a year. It is the change in the index compared to the same month the previous year.
The monthly rate compares values with the previous month; the implied “target rate” is ~0.17.
10
The monthly rate compares values with the previous month; the implied “target rate” is ~0.17.
10
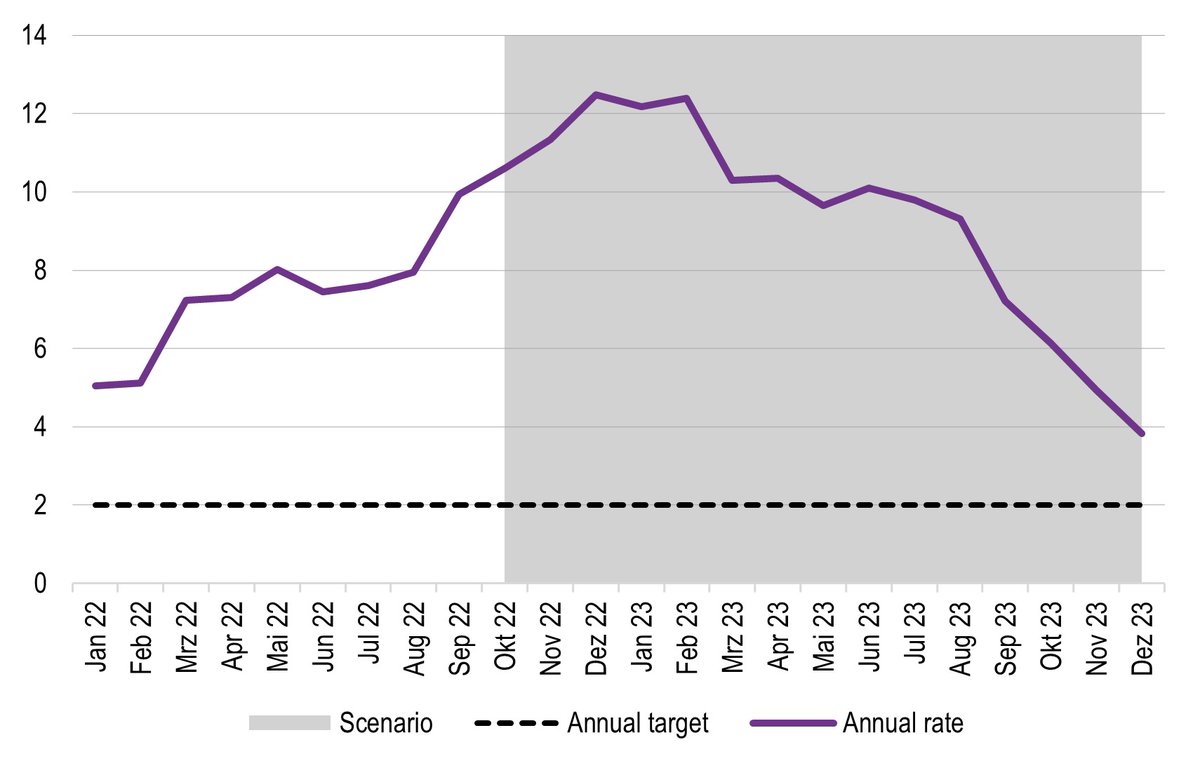
Here are the corresponding values for the annual and monthly rates. Shockingly, we see that the very high 2023 average-annual rate, higher than 2022, is readily compatible with an annual inflation rate of 3.8% at end 2023, still above target, but not hugely so, and falling.
11

11


Moreover, the monthly rate, the best indicator of price dynamics, could plausibly be already *below* the inflation target already by late 2023.
This is exactly when restrictive monetary (or fiscal) policy now would make their effects felt on prices (and employment).
12
This is exactly when restrictive monetary (or fiscal) policy now would make their effects felt on prices (and employment).
12
How can this apparent discrepancy be explained?
Base effects:
Briefly, inflation in the 2nd half of year 1 adds to the annual average, but also pushes up the starting point of year 2’s index. Part of the annual-ave inflation increase for year 2 has already occured in year 1!
13
Base effects:
Briefly, inflation in the 2nd half of year 1 adds to the annual average, but also pushes up the starting point of year 2’s index. Part of the annual-ave inflation increase for year 2 has already occured in year 1!
13
If late-year monthly price rises are large, it creates a large “overhang” which means that, for a given annual average, monthly rates in the following year have to be lower. Currently inflation *is* now very high and so the overhang going into 2023 is very substantial.
14
14
The annual rate must therefore fall quite markedly in 2023. Still, it takes 12 months for rapid price rises to drop out of the numbers.
The most oft-cited inflation measure, which dominates the policy discourse, is thus to a considerable degree backward-looking.
15
The most oft-cited inflation measure, which dominates the policy discourse, is thus to a considerable degree backward-looking.
15
If attention were paid to the monthly rate it would offer a much better guide to the underlying dynamic (after allowances for data noise). But in practice it is barely present in the debate.
Before concluding, let me anticipate 3 arguments:
#caveats
16
Before concluding, let me anticipate 3 arguments:
#caveats
16
It's true that, for a given forecast, the index path is not mechanically determined. But the scope for variation from the one given is limited. You can delay the fall in inflation rates, but then you have to compensate with, probably, negative monthly rates at year’s end.
17
17
Conversely, to get higher year-end rates, inflation would need to fall off a cliff in spring.
(In fact the GD includes a graph with forecast quarterly rates (p. 42 of gemeinschaftsdiagnose.de/wp-content/upl… ) which has a similar form to my scenario.)
18
(In fact the GD includes a graph with forecast quarterly rates (p. 42 of gemeinschaftsdiagnose.de/wp-content/upl… ) which has a similar form to my scenario.)
18
Ofc the scenario path depends on the annual-average forecast chosen. The GD might be too optimistic. OTOH it might be too pessimistic. The same exercise based on our @IMKFLASH forecast (7.8%, 5.7%) implies a decent chance of *negative* monthly inflation by end 2023.
19

19


Finally, doesn’t this all assume that #ECB doesn’t know what it is doing?
No. Of course ECB understands base effects. But it does not take decisions in a vacuum. Politicians & journalists mostly don’t understand technical issues (or have an interest in misrepresenting them).
20
No. Of course ECB understands base effects. But it does not take decisions in a vacuum. Politicians & journalists mostly don’t understand technical issues (or have an interest in misrepresenting them).
20
& I’ve heard plenty of “serious” economists arguing from current annual inflation rates. These wont fall noticeably until spring. By then the drumbeat of public & supposedly “informed” opinion might well have pushed interest rates higher ensuring a steep(er) recession in 2023.
21
21
Ofc there is much uncertainty, esp about the war & energy prices. But our current best guess is that 🇩🇪and €A inflation will *not* be high, but low & falling by the time policy decisions taken now affect it. Any further monetary tightening must be justified against this fact.
22
22
While it's certainly sensible to design fiscal policy measures so they raise prices (& energy consumption) as little as possible, efforts to mitigate fuel poverty & sustain real incomes shd also be taken w/ a view to end-2023 inflation being lower than commonly perceived.
end
end
• • •
Missing some Tweet in this thread? You can try to
force a refresh


