Best way to use #RSI for Trading
What is RSI indicator?
RSI is used on price to identify oversold and overbought market conditions. In relative terms, when RSI line touches the 30 line, price is said to be oversold. When RSI touches the 70 line, price is said to be overbought.
What is RSI indicator?
RSI is used on price to identify oversold and overbought market conditions. In relative terms, when RSI line touches the 30 line, price is said to be oversold. When RSI touches the 70 line, price is said to be overbought.
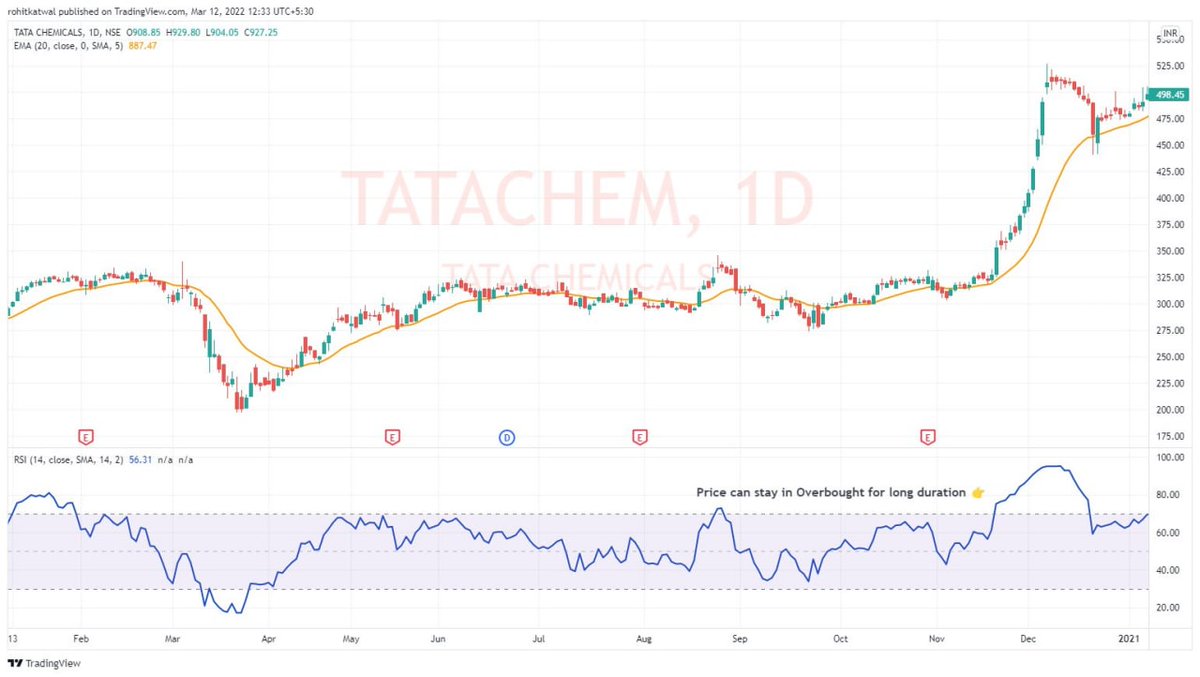
Problem of using RSI traditionally is that in heavily trending market #RSI can remain oversold and overbought for a considerably long duration. Consider example of #TATACHEM for example. If you keep selling because of RSI Oversold, you can continue to make losses. 

So the proper way is to use RSI + Divergence.
What is RSI Divergence? When price is moving in opposite direction of the RSI.
1. Near 70, Price is making Higher Highs & RSI is making Lower Highs; or
2. Near 30, Price is making Lower Lows & RSI is making Higher Lows.
What is RSI Divergence? When price is moving in opposite direction of the RSI.
1. Near 70, Price is making Higher Highs & RSI is making Lower Highs; or
2. Near 30, Price is making Lower Lows & RSI is making Higher Lows.
Consider #LICHSGFIN for example on 2HR time frame. Price made lower highs and RSI made higher lows which is a Buy Side Divergence. I was actually short at this level and made a loss on this trade. I got a timely exit as I spotted divergence recently.

Consider example of #TATACOMM on 1HR timeframe. Price made a higher high and RSI made lower high which is a sell side divergence.

Two type of Main RSI Divergence
Wide Divergence
Tight Divergence
Wide Divergence is when difference between Higher Lows or Lower Highs of Price are wide noticeable to naked eyes.
Tight Divergence is when we have to shift to Line Chart to observe a divergence,
Wide Divergence
Tight Divergence
Wide Divergence is when difference between Higher Lows or Lower Highs of Price are wide noticeable to naked eyes.
Tight Divergence is when we have to shift to Line Chart to observe a divergence,
Attached are examples of Wide & Tight Divergence.
Wide Divergence - Notice how wide Divergence on #BHARTIARTL is visible.
Tight Divergence - If you look at #Nifty Hourly chart, tight divergence is not visible. But when we change it to line chart, there is a tight divergence.
Wide Divergence - Notice how wide Divergence on #BHARTIARTL is visible.
Tight Divergence - If you look at #Nifty Hourly chart, tight divergence is not visible. But when we change it to line chart, there is a tight divergence.


Here is live commentary on RSI Tight Divergence.


Now that we know what divergence on RSI is, we need to understand how to use it.
Best way to use divergence is at Support and Resistance(S&R) Levels. If you do not know how to identify S&R, I recommend you read the thread on understanding price action.
Best way to use divergence is at Support and Resistance(S&R) Levels. If you do not know how to identify S&R, I recommend you read the thread on understanding price action.
https://twitter.com/rohit_katwal/status/1499809511196049414
Divergence at S&R Level.
1. Identify the S&R level.
2. Identify the RSI Divergence.
3. Identify the Entry Signal using trend line.
4. Exit at a predetermined target or trailing SL of 20 EMA.
Consider example of #LICHSGFIN and #EICHERMOT and important markers.
1. Identify the S&R level.
2. Identify the RSI Divergence.
3. Identify the Entry Signal using trend line.
4. Exit at a predetermined target or trailing SL of 20 EMA.
Consider example of #LICHSGFIN and #EICHERMOT and important markers.


Divergence Inside Smaller Time Frame inside Bigger Time Frame.
Consider #TATAMOTORS on daily charts. From 12 Oct to 18 Nov, price is making double top. There is a slight divergence on Daily Charts but no entry.
Consider #TATAMOTORS on daily charts. From 12 Oct to 18 Nov, price is making double top. There is a slight divergence on Daily Charts but no entry.

Now look at the same chart on 1HR Chart. This is called divergence within divergence for further narrowing the entry.
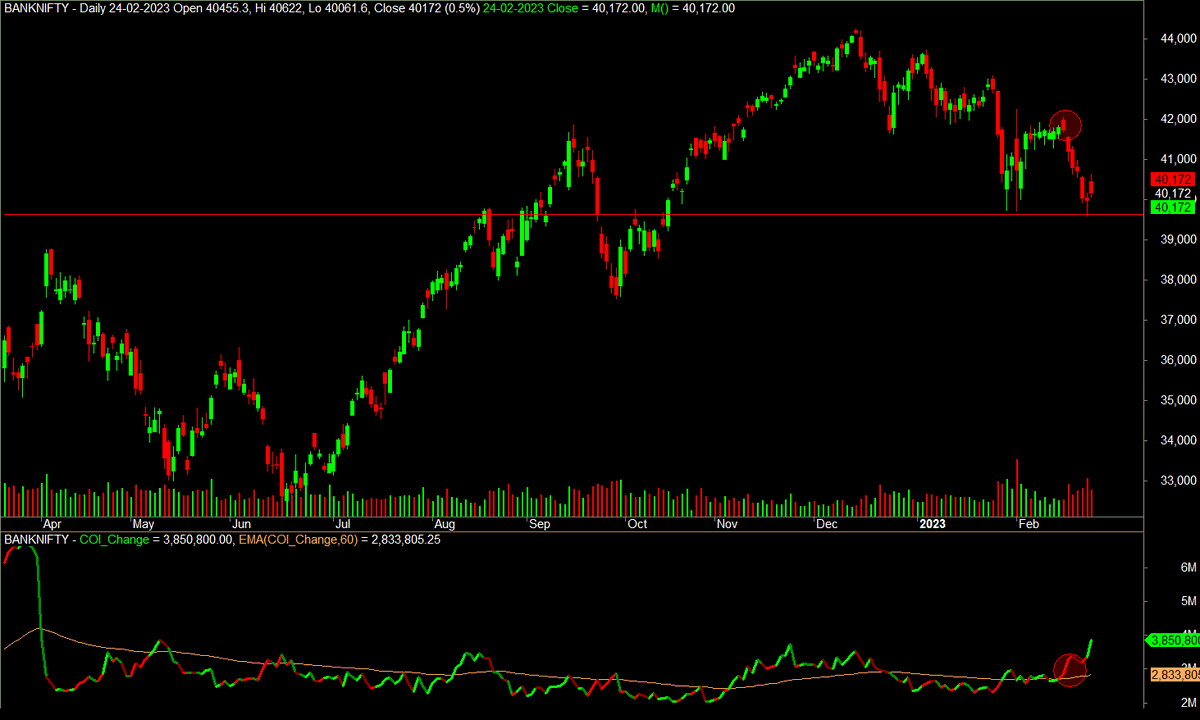
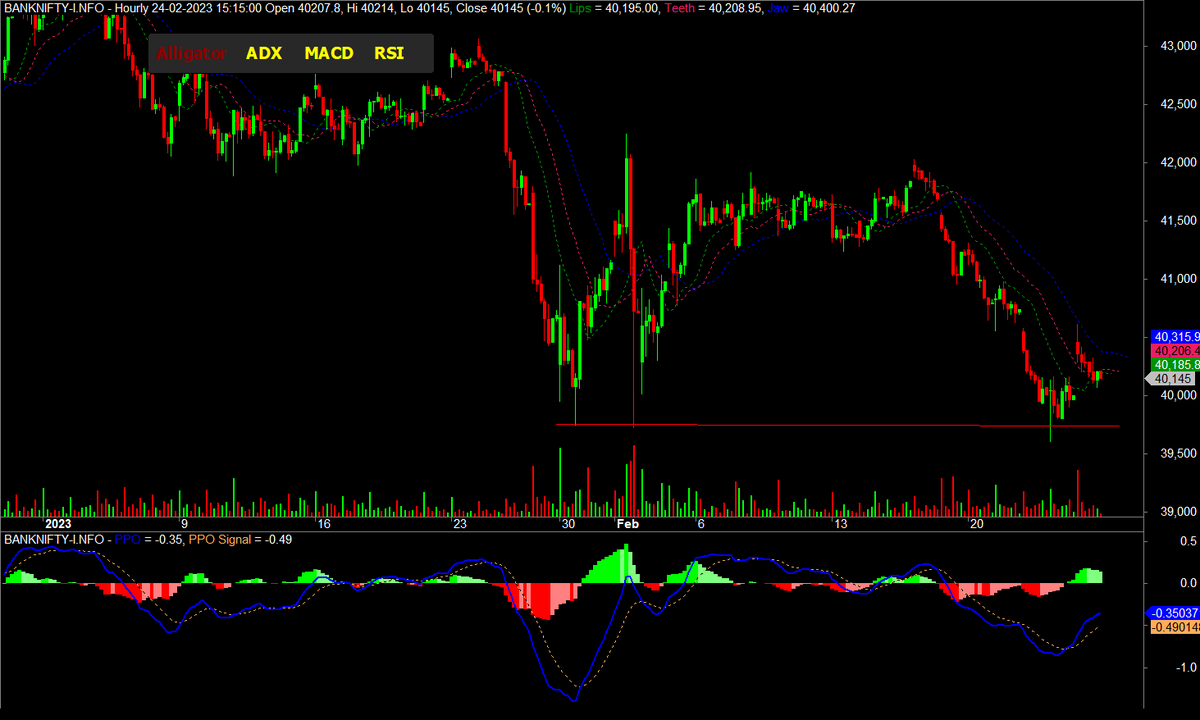
RSI in conjunction with other indicators like MACD can be used to identify whether the trend breakout is genuine or can be a reversal.
RSI in conjunction with other indicators like MACD can be used to identify whether the trend breakout is genuine or can be a reversal.

In this method here I have used Trend Line for entry. Like any other system, trader must understand the importance of Risk Management & Position Sizing. One can use PSAR, Supertrend or EMA20 for trailing SL. It is a personal choice of trader for what works for them.
This was just a small effort from my side. If you have more examples of RSI Divergence, I request you to share here under comments in this thread itself.
Do share and retweet this thread if it helped you.
Do let me know what trading topic we should cover next in comments.
Do share and retweet this thread if it helped you.
Do let me know what trading topic we should cover next in comments.
• • •
Missing some Tweet in this thread? You can try to
force a refresh