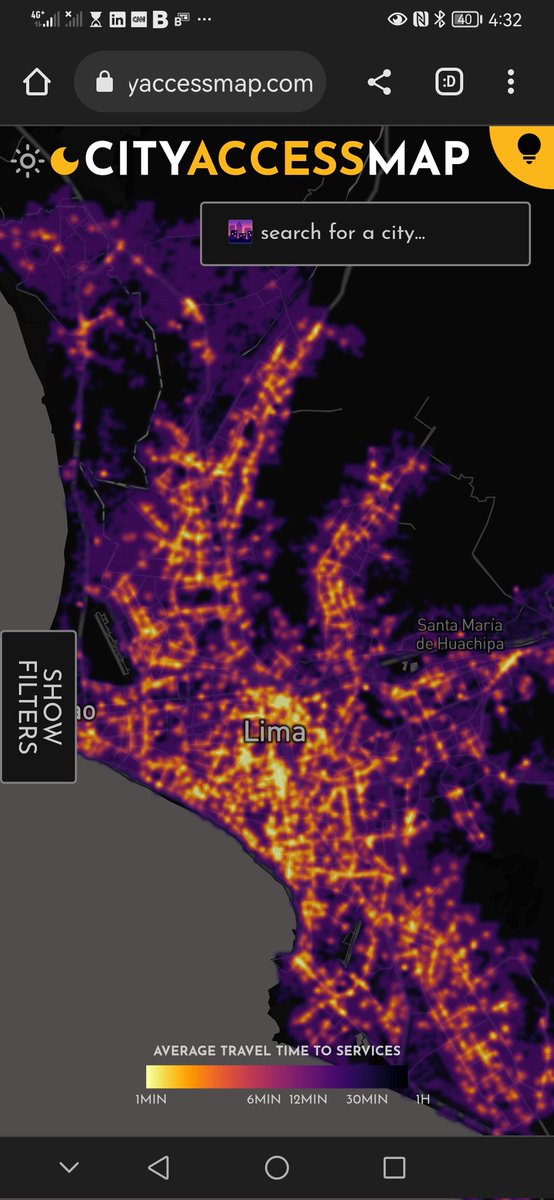
The web-app uses #OpenData to visualize access to a variety of #essentialservices. By considering where people live, CityAccessMap measures how much of a city's population has access to things like transit/bus stops or health facilities. The app is entirely customizable.
🧵2/6
The user can switch services on and off. Here's an example of accessibility to pharmacies, clinics, hospitals and other health services in Lima, Perú.
🧵3/6
The user can also set temporal thresholds to quickly identify areas of interest. Here's an example of all the areas where you can reach libraries and community centers within a 5 minute walk in Krakow, Poland.
🧵4/6
You can also compare a city's accessibility levels with other cities across the same country or the world. For example the app will show you that Memphis is one of the least accessible cities in the United States. Only 17% of the population have access to services there.
🧵5/6
Addressing spatial #inequalities with data should be possible for any city or planning department, no matter what their resources are. That's why we built CityAccessMap. If you find it valuable, please share it with others!
🧵6/6
🚨NEW🚨: AI Is Wreaking Havoc on Global Power Systems
We analyzed data on 1000s of data centers and found that AI data centers are coming online so fast that electricity demand is straining global power grids and threatening clean energy goals
🎁 tinyurl.com/572p2mk2
Data centers use A MASSIVE AMOUNT of electricity, more than most countries use in an entire year
Because of their huge electricity capacity, data centers are also HUGE, literally, some of these buildings are now the size of 130 soccer fields or TWICE the size of the mall of America (the biggest shopping mall in the US with a rollercoaster inside).
@LeonYin @daveyalba and I ran thousands of resume screening tests with GPT-3.5 and GPT-4 and found that the tech will racially discriminate applicants based only on their name. Serious implications. 🧵 1/10
For each of 4 real job postings, we used 8 resumes with equal qualifications and experience, but different names, and asked GPT to pick the best and worst candidates. Even though the resumes are equally qualified, GPT chose a top candidate for the role.
We repeated this experiment 1000 times and uncovered clear signs of name-based discrimination: resumes with names distinct to Black Americans were the least likely to be ranked as the top candidate for a financial analyst role, compared to other races.
Over months of reporting, @dinabass and I looked at thousands of images from @StableDiffusion and found that text-to-image AI takes gender and racial stereotypes to extremes worse than in the real world.
🧵 1/13
We asked Stable Diffusion, perhaps the biggest open-source platform for AI-generated images, to create thousands of images of workers for 14 jobs and 3 categories related to crime and analyzed the results.
🧵 2/13 bloomberg.com/graphics/2023-…
What we found was a pattern of racial and gender bias. Women and people with darker skin tones were underrepresented across images of high-paying jobs, and overrepresented for low-paying ones.
🧵 3/13 bloomberg.com/graphics/2023-…