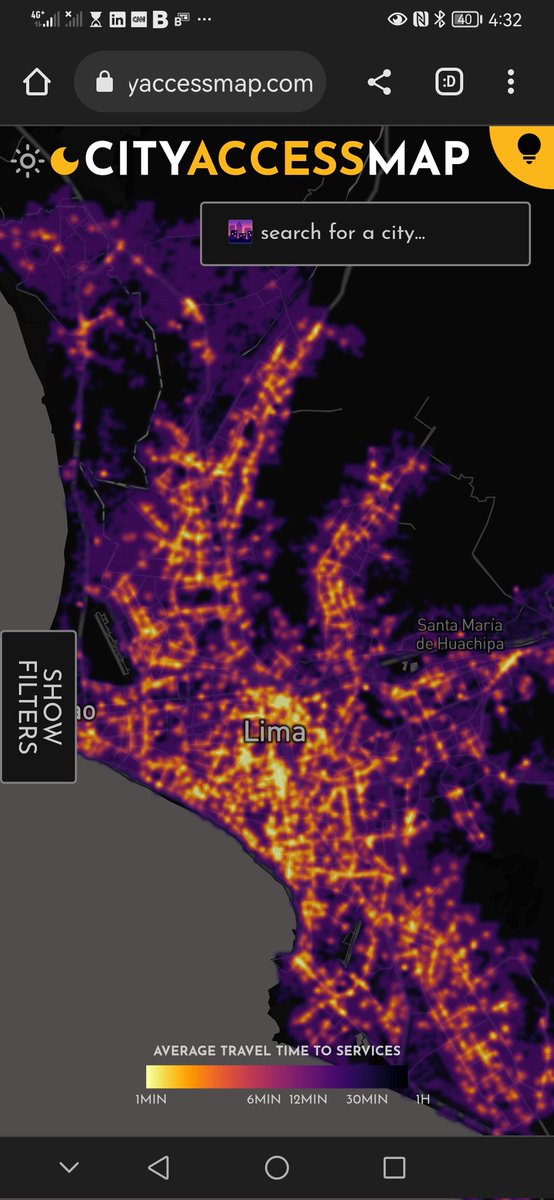
Planners, #policymakers, #gis and #dataviz people of twitter, @TrivikV @mikhailsirenko and I released a new #opensource project: CityAccessMap. It's an open source #webapplication that visualizes urban #accessibility insights for almost every city in the globe 🌐.
🧵1/6
🧵1/6
The web-app uses #OpenData to visualize access to a variety of #essentialservices. By considering where people live, CityAccessMap measures how much of a city's population has access to things like transit/bus stops or health facilities. The app is entirely customizable.
🧵2/6
🧵2/6

The user can switch services on and off. Here's an example of accessibility to pharmacies, clinics, hospitals and other health services in Lima, Perú.
🧵3/6
🧵3/6

The user can also set temporal thresholds to quickly identify areas of interest. Here's an example of all the areas where you can reach libraries and community centers within a 5 minute walk in Krakow, Poland.
🧵4/6
🧵4/6

You can also compare a city's accessibility levels with other cities across the same country or the world. For example the app will show you that Memphis is one of the least accessible cities in the United States. Only 17% of the population have access to services there.
🧵5/6
🧵5/6

Addressing spatial #inequalities with data should be possible for any city or planning department, no matter what their resources are. That's why we built CityAccessMap. If you find it valuable, please share it with others!
🧵6/6
🧵6/6
• • •
Missing some Tweet in this thread? You can try to
force a refresh


