Trading is not easy. Takes lots of time just to master the basics. Here's my list of 14 top-quality master cheat sheets to help you learn faster👇🧵
#1 Master Cheat Sheet
Basic terms and definitions regarding polarity change principle, order blocks, as well as throwbacks.
Basic terms and definitions regarding polarity change principle, order blocks, as well as throwbacks.

#2 Master Cheat Sheet
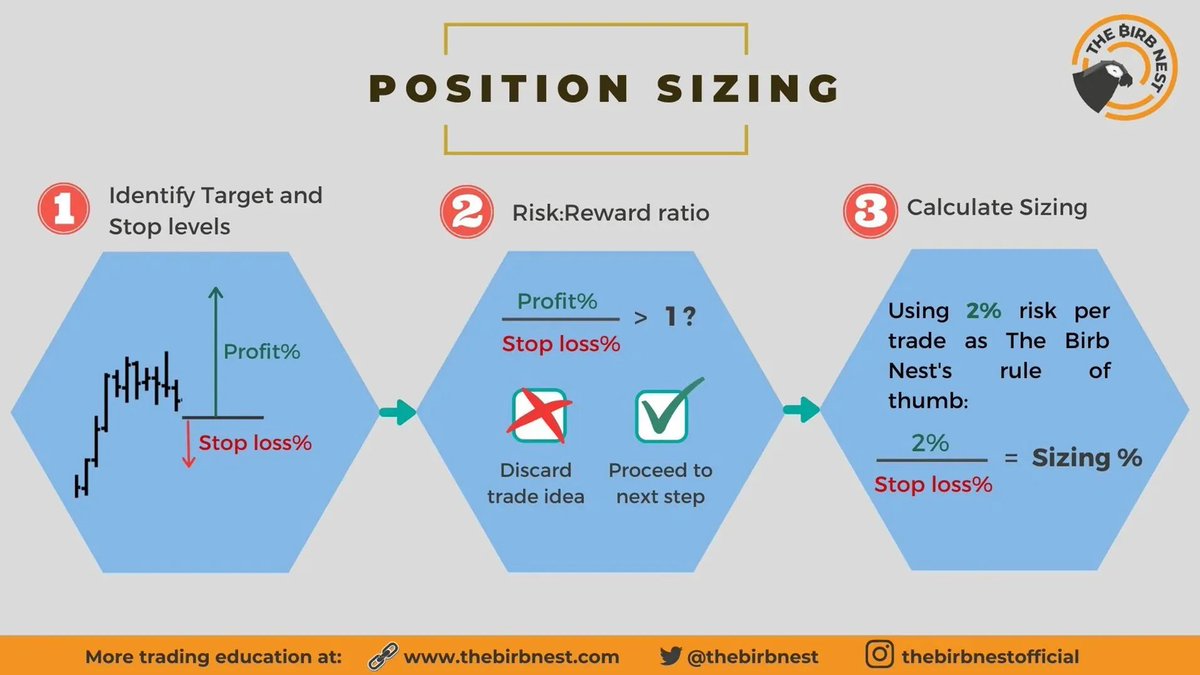
Position sizing or money management is a subject to many theories to find the optimal size of an entry. This piece below can suggest where to start.
Position sizing or money management is a subject to many theories to find the optimal size of an entry. This piece below can suggest where to start.
#3 Master Cheat Sheet
Mean reversion trading relies on the principles of oversold and overbought trends, which trigger divergences. Here's an example of how to read regular vs. hidden divergences.
Mean reversion trading relies on the principles of oversold and overbought trends, which trigger divergences. Here's an example of how to read regular vs. hidden divergences.

#5 Master Cheat Sheet
Price and volume can sometimes help determine market tops and bottoms, but not always.
Here's how to interpret price vs. volume changes
Price and volume can sometimes help determine market tops and bottoms, but not always.
Here's how to interpret price vs. volume changes

#6 Master Cheat Sheet
How about a bad trading day, when nothing goes right?
Check this set of tips on how to well handle the mindset
How about a bad trading day, when nothing goes right?
Check this set of tips on how to well handle the mindset

#7 Master Cheat Sheet
At any time, should you NOT trade without a well-defined trading plan.
See all the necessary factors to figure out.
At any time, should you NOT trade without a well-defined trading plan.
See all the necessary factors to figure out.

#8 Master Cheat Sheet
What are the 5 facts you must know about #BTC.
Do you agree the price is not affected by the economy or central banks (directly)?
What are the 5 facts you must know about #BTC.
Do you agree the price is not affected by the economy or central banks (directly)?

#9 Master Cheat Sheet
Trend following is empirically proven to be the most profitable technique, while it generates a lot of small losses from sideways noise.
These trend indicators below will help.
Trend following is empirically proven to be the most profitable technique, while it generates a lot of small losses from sideways noise.
These trend indicators below will help.

#10 Master Cheat Sheet
To add to the trend following part - it works best when connected with volatility filters, like ATR.
Discover how it works.
To add to the trend following part - it works best when connected with volatility filters, like ATR.
Discover how it works.

#11 Master Cheat Sheet
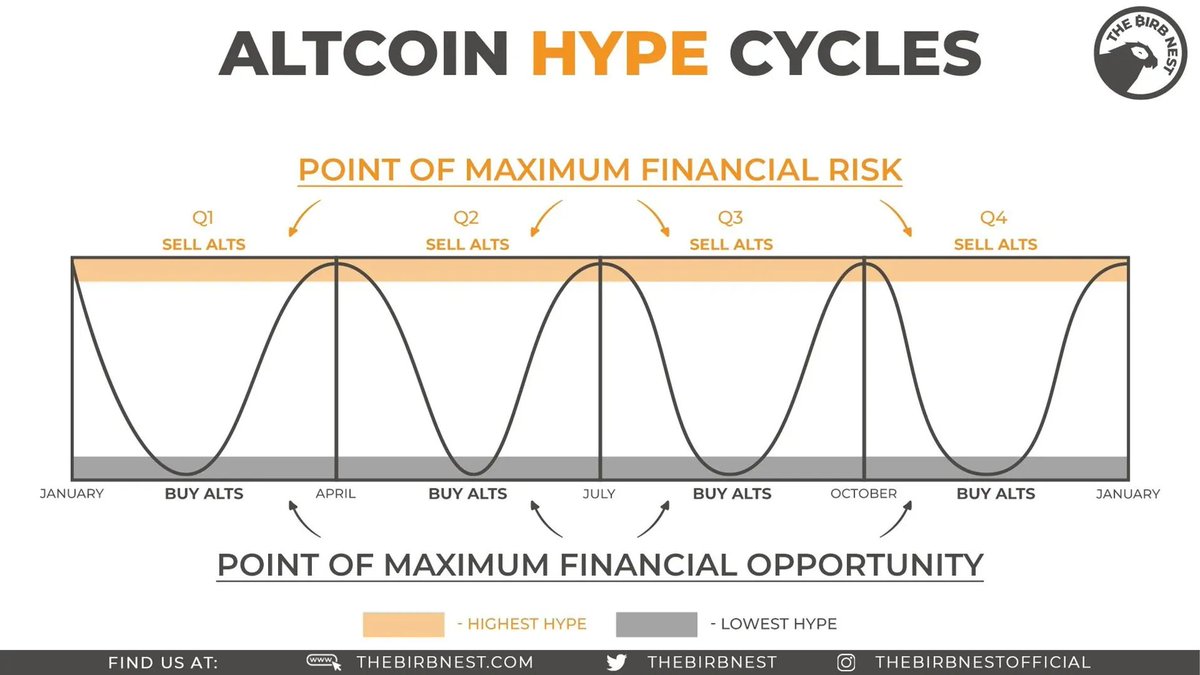
Interested in #altcoins?
Here's a typical seasonality pattern to often work.
Would you agree with it?
Interested in #altcoins?
Here's a typical seasonality pattern to often work.
Would you agree with it?
#12 Master Cheat Sheet
Day trading is often misunderstood and approached wrongly.
How is it different from swing trading?
Day trading is often misunderstood and approached wrongly.
How is it different from swing trading?

#13 Master Cheat Sheet
Range trading expectations vs. reality
Who's ready to hear how NOT to get trapped?🤔👀
Range trading expectations vs. reality
Who's ready to hear how NOT to get trapped?🤔👀

#14 Master Cheat Sheet
Understanding losses are inevitable in this business requires strict risk control.
Here's something I wanted you to take away on that note.
Hope my thread helps you learn how to trade profitably faster.
Let me know in the comment if want more of these🧡
Understanding losses are inevitable in this business requires strict risk control.
Here's something I wanted you to take away on that note.
Hope my thread helps you learn how to trade profitably faster.
Let me know in the comment if want more of these🧡
There are many new traders joining every single day. Be friends with them and help them learn.
If you enjoy this thread, you should:
1. Follow me (alpha every day)
2. Like and retweet the head tweet
3. Get ready for my SPECIAL ANNOUNCEMENT - can't wait👀
If you enjoy this thread, you should:
1. Follow me (alpha every day)
2. Like and retweet the head tweet
3. Get ready for my SPECIAL ANNOUNCEMENT - can't wait👀
https://twitter.com/crypto_birb/status/1589334358175121408?s=20&t=6byxK3qGOM1PTwtGKvaJYg
420
Big announcement release tonight. I'm pumped af. If you've loved this thread, you're going to love this event. Follow not to miss it.👊
Big announcement is here! Free money to win❗️👇
https://twitter.com/crypto_birb/status/1589693883855749120
BTW, I'm really glad this thread blew up. Lots of beginning traders will have a chance to see it and learn faster. Now, that my free trading congress is coming to you Nov 21-28, you will catch even more top-quality content every day. Free for all. Enrol 👉 bit.ly/3zU7nRz

• • •
Missing some Tweet in this thread? You can try to
force a refresh