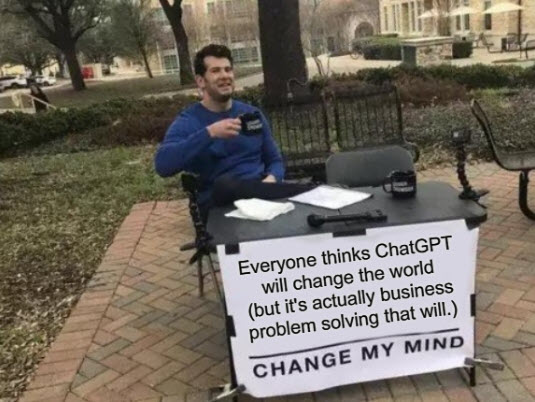
This used to be me when I was first learning linear regression. 😂

But here's what's changed for me. 🧵

#datascience #rstats #stats
I always thought it was funny how in the stats books, they'd always tell you of this magical P-Value level of 0.05.

You either reject (p > 0.05) or fail to reject (keep it when p <= 0.05).

So naturally, I'd do whatever I could to get my p-values under 0.05.

So what changed?
I started learning machine learning and actually seeing that my model performance would improve with features that had p-values greater than 0.05.

Wait, what?!
This magical p-value was actually costing me good information?!!!

Yup.
So fast-forward to today. I still use Linear Regression...

...But, I make more accurate forecasts and churn models using new algorithms like XGBoost & H2O.

And what's cool is these algorithms will help you.
These algorithms penalize bad features so we don't have to drop them cold-turkey style like with Linear Regression.

You just have to know how to use these algorithms.

Anyways, I guess what I'm saying is...
It took me painfully long to learn secrets like this. Like 5-years.

And, I don't want you to have to take EONS to learn too.
In fact, I'd like to help you.

I put together a free webinar - It's 40-minutes of training on the 10 secrets that took me 5 years to learn on my path to becoming a data scientist.
Literally what worked, and what mistakes to avoid in your path.

I cover all of it in one value-packed training.
What's your next step?

It's simple.

Just watch my free 40-minute webinar and take good notes (you'll thank me).

Watch here: learn.business-science.io/free-rtrack-ma…

• • •

Missing some Tweet in this thread? You can try to force a refresh
 

Keep Current with Matt Dancho (Business Science)

Matt Dancho (Business Science) Profile picture

Stay in touch and get notified when new unrolls are available from this author!

Read all threads

This Thread may be Removed Anytime!

PDF

Twitter may remove this content at anytime! Save it as PDF for later use!

Try unrolling a thread yourself!

how to unroll video
  1. Follow @ThreadReaderApp to mention us!

  2. From a Twitter thread mention us with a keyword "unroll"
@threadreaderapp unroll

Practice here first or read more on our help page!

More from @mdancho84

Dec 9
What is a Business Scientist? 🧵

#datascience
I’m seeing an underground trend forming in data jobs.

A high focus on data with a lack of:
1. Building

Lack of building products that companies can use to make decisions
Read 14 tweets
Dec 8
Bold Prediction for 2023 - #ChatGPT has almost no impact on businesses...

Here's why 🧵

#datascience #stats Image
While everyone's playing around with ChatGPT, here's what's about to happen that will actually change 2023

It's the "Birth of the Business Scientist". Image
Listen, ChatGPT is great, and may make you more productive at work....

But, businesses actually need strategic thinkers (and that's really tough to automate).
Read 13 tweets
Dec 4
Bold prediction for 2023: The Birth Of The Business Scientist.

Here's what is about to happen. 🧵

#datascience #python #rstats #stats
According to Glassdoor research, we already have:

1. Data Analyst, $71,298/yr
2. Business Analyst, $83,924/yr
3. Data Scientist, $124,680/yr

But noticeably missing is the "Business Scientist".
So what is a "Business Scientist"?

And why are we about to see the birth of this new role?
Read 15 tweets
Dec 3
Having a tough time in this data science job market?

Here’s a secret.

Stop learning python.

And start learning R. 🧵

#rstats #datascience
With Twitter, Facebook & Amazon announcing massive layoffs, the job market is trickier than ever.

What do you when there’s now massive competition?
95% of data scientists are competing for the same old data science jobs.

- Python
- Pandas
- Matplotlib
- Scikit learn

If that’s your strategy, you are a commodity.
Read 11 tweets
Dec 2
You may not be the best coder, but don’t lose sight of the main goal: results.

Clean code takes time.

You’ll get better.🧵

#rstats #datascience #stats #code Image
This meme was presented in John Paul Helveston’s undergrad R class...

...to blank stares, because most students were born AFTER 2003 when Pirates of the Caribbean came out.

While John got blank stares from his students, his point is well taken over here.
My code wasn’t always good.

In fact, if I look back at my early code, it was terrible.

BUT IT STILL RUNS!!!
Read 7 tweets
Nov 30
Ever have too many groups to visualize on a plot?

Here's a 3-step process I use frequently to consolidate groups with #R.

#rstats Image
Consolidating groups is super common...

I use this process for consolidating sales data all the time

(like how many purchases customers made by product over Black Friday)

And, I often have too many groups to visualize.

Here's how I get the top N groups.
There are 3 basic steps...

1. Reduce groups

2. Grouped summarize

3. Visualize
Read 10 tweets

Did Thread Reader help you today?

Support us! We are indie developers!


This site is made by just two indie developers on a laptop doing marketing, support and development! Read more about the story.

Become a Premium Member ($3/month or $30/year) and get exclusive features!

Become Premium

Don't want to be a Premium member but still want to support us?

Make a small donation by buying us coffee ($5) or help with server cost ($10)

Donate via Paypal

Or Donate anonymously using crypto!

Ethereum

0xfe58350B80634f60Fa6Dc149a72b4DFbc17D341E copy

Bitcoin

3ATGMxNzCUFzxpMCHL5sWSt4DVtS8UqXpi copy

Thank you for your support!

Follow Us on Twitter!

:(