
#Bitcoin ON-CHAIN ANALYSIS
Preface, I am not an on-chain analyst I have no interest in going to view rainbows or data that is useless to me.
I want to Focus in going to 360 degree look at what is going on and will be happy to read any thoughts below.
👇👇👇
Preface, I am not an on-chain analyst I have no interest in going to view rainbows or data that is useless to me.
I want to Focus in going to 360 degree look at what is going on and will be happy to read any thoughts below.
👇👇👇
This Thread will be very long and divided into 12 parts,
For each part there will be a brief explanation of the chart we are looking at and my separate observation if needed.
This data is taken from the look into #bitcoin site accessible to all.
👇👇👇👇
For each part there will be a brief explanation of the chart we are looking at and my separate observation if needed.
This data is taken from the look into #bitcoin site accessible to all.
👇👇👇👇
1/12
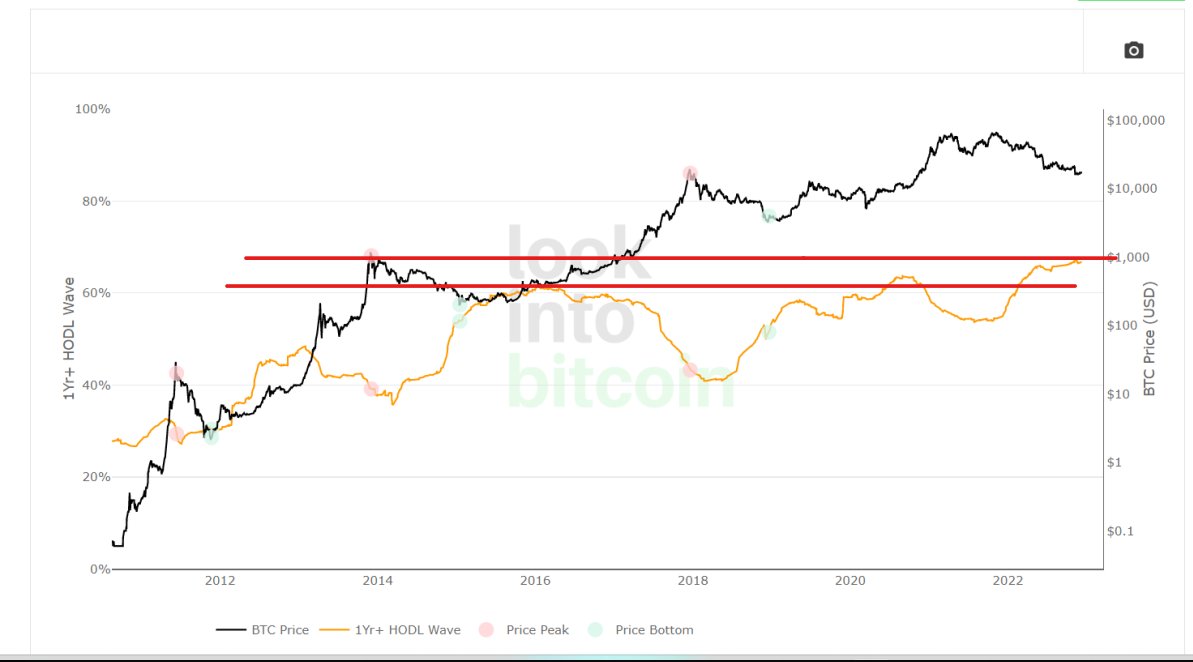
This tool analyzes a group of market participants to understand their behavior and identify their potential impact on the price of #Bitcoin.
(Picking up address in photo 3*)
This tool analyzes a group of market participants to understand their behavior and identify their potential impact on the price of #Bitcoin.
(Picking up address in photo 3*)
2/12
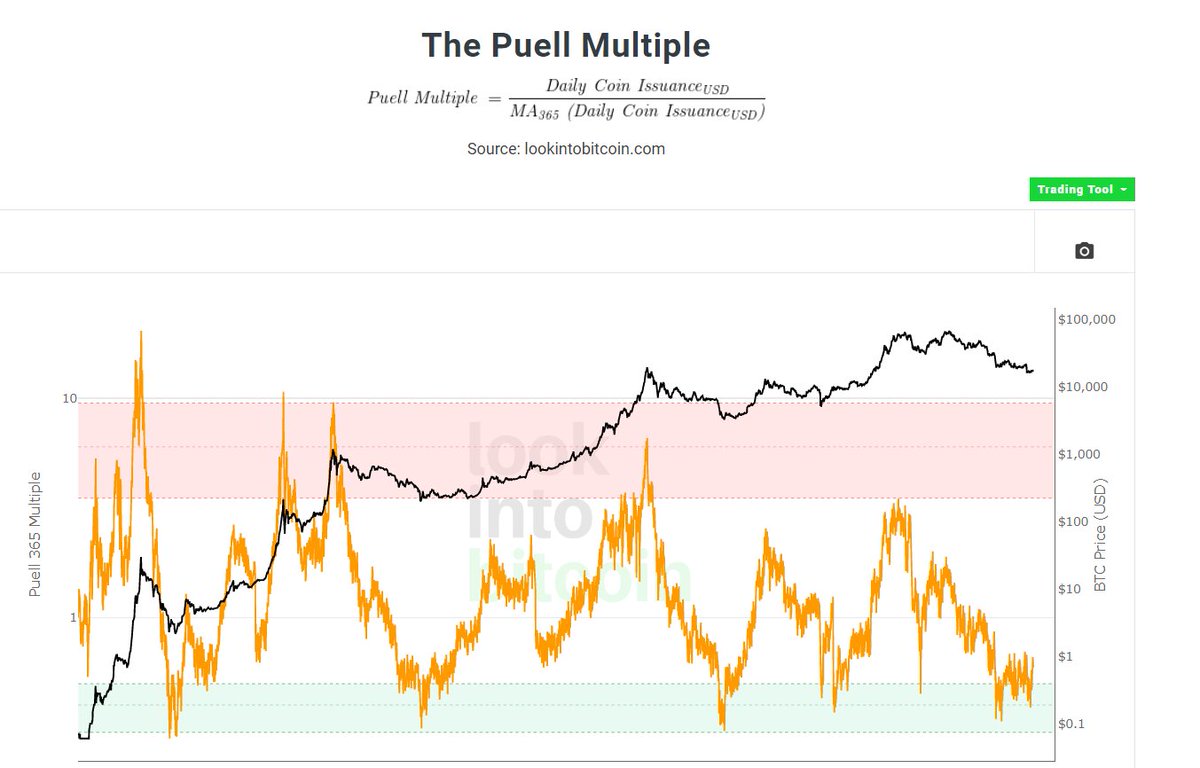
The key principle of this tool is in the relationship between market capitalization and investors in #Bitcoin taking profit.
When market capitalization increases much faster than profit taking, we see that the market is overheating, one might say because of investor greed.
The key principle of this tool is in the relationship between market capitalization and investors in #Bitcoin taking profit.
When market capitalization increases much faster than profit taking, we see that the market is overheating, one might say because of investor greed.

3/12
For the strategic investor these times have historically been favorable for profit taking.
Looking at the image we can see a large divergence between May and November marked in red and blue, and capitulation with a good margin to create another one in the coming months.
For the strategic investor these times have historically been favorable for profit taking.
Looking at the image we can see a large divergence between May and November marked in red and blue, and capitulation with a good margin to create another one in the coming months.

4/12
Here the situation becomes quite critical, we see how addresses that have been dormant for + 10 years are taking profits on important lows. this indicator shows how smart money is moving, the question is: smart money but in the wrong hands? or do they know something more?
Here the situation becomes quite critical, we see how addresses that have been dormant for + 10 years are taking profits on important lows. this indicator shows how smart money is moving, the question is: smart money but in the wrong hands? or do they know something more?

5/12
The number of addresses on the #Bitcoin blockchain that have sent or received transactions
This is a metric to be tracked over time that shows the amount of activity taking place on the network. As #Bitcoin is adopted over time, the number of active addresses increases.
The number of addresses on the #Bitcoin blockchain that have sent or received transactions
This is a metric to be tracked over time that shows the amount of activity taking place on the network. As #Bitcoin is adopted over time, the number of active addresses increases.

6/12
Here again we can see how since May there has never been a return to the activity of that time period.
November all time high has created a huge divergence. THE MARKET HAS BEEN PUMPED BY THE FUTURES!
Here again we can see how since May there has never been a return to the activity of that time period.
November all time high has created a huge divergence. THE MARKET HAS BEEN PUMPED BY THE FUTURES!

7/12
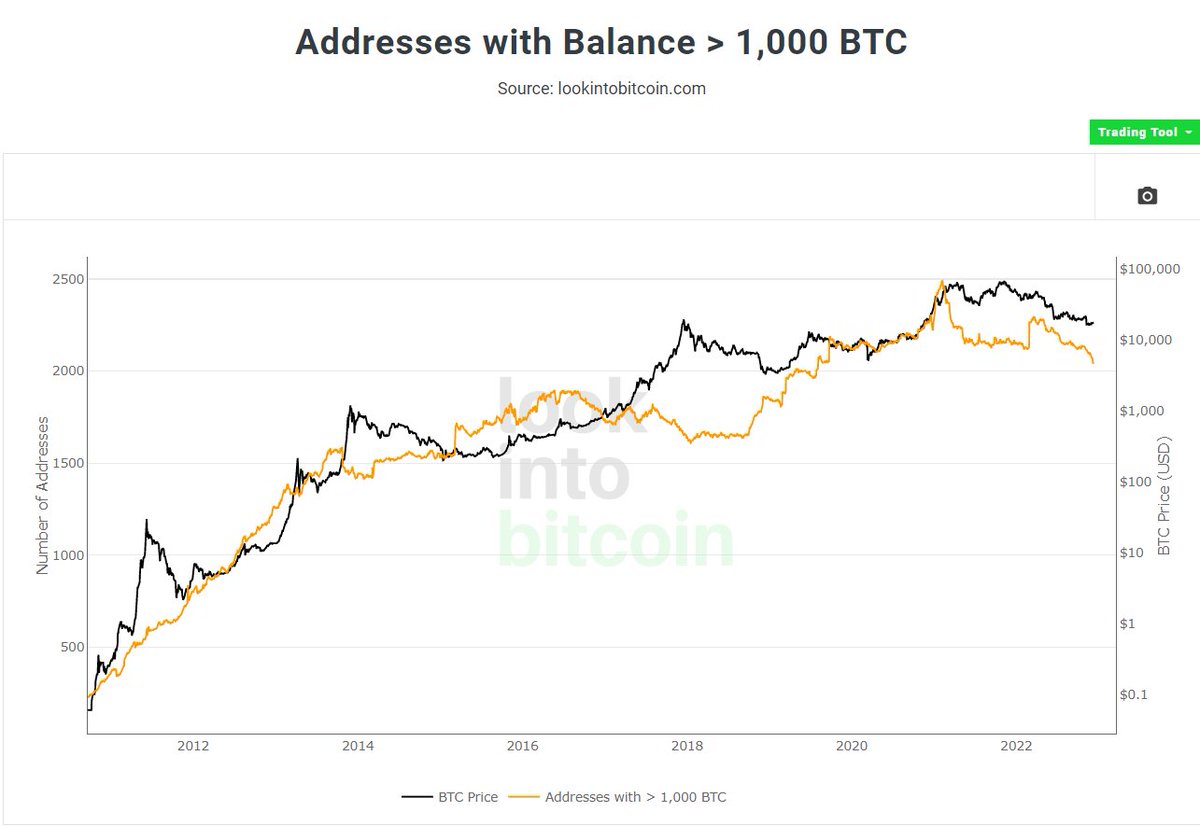
Real-time #bitcoin chart showing the number of unique addresses holding at least 10 #BTC in the first picture, and 1 #BTC in the second.
And even here we can see how large entities are selling and retail are continuing to create new all-time highs.
Real-time #bitcoin chart showing the number of unique addresses holding at least 10 #BTC in the first picture, and 1 #BTC in the second.
And even here we can see how large entities are selling and retail are continuing to create new all-time highs.

8/12
#Bitcoin hashrate is a metric related to the mining process, which protects the network and also confirms the correctness of transactions on the #blockchain.
If the #hashrate on the #Bitcoin network is high this indicates that the network is secure and robust.
#Bitcoin hashrate is a metric related to the mining process, which protects the network and also confirms the correctness of transactions on the #blockchain.
If the #hashrate on the #Bitcoin network is high this indicates that the network is secure and robust.
9/12
Large drops in hash rates can represent changes or risks to the network. In bearish markets, some #miners may have difficulty generating profits and will shut down their mining facilities. On a large enough scale, this significantly reduces hashrate.
Large drops in hash rates can represent changes or risks to the network. In bearish markets, some #miners may have difficulty generating profits and will shut down their mining facilities. On a large enough scale, this significantly reduces hashrate.

10/12
The #Bitcoin Hash Ribbon indicator seeks to identify periods when #Bitcoin #miners are in trouble and may capitulate.
The assumption is that such periods may occur when the price of $BTC is at major lows and may therefore present a good opportunity to buy the drop.
The #Bitcoin Hash Ribbon indicator seeks to identify periods when #Bitcoin #miners are in trouble and may capitulate.
The assumption is that such periods may occur when the price of $BTC is at major lows and may therefore present a good opportunity to buy the drop.

11/12
As we can also see from this chart, there is still a long way to go, and it looks like it will be very tumultuous and full of pitfalls. security is growing, usage too.
follow the next module and I will make my final remarks
As we can also see from this chart, there is still a long way to go, and it looks like it will be very tumultuous and full of pitfalls. security is growing, usage too.
follow the next module and I will make my final remarks

12/12
Final Consideration
Networking and adoption continue undaunted away from #speculation and prices.
#Miners begin the second wave of major labors, #Europe could play a key role in this.
#Retailers are buying the dip, OG #Whales are moving their bitcoins from early cycle.
Final Consideration
Networking and adoption continue undaunted away from #speculation and prices.
#Miners begin the second wave of major labors, #Europe could play a key role in this.
#Retailers are buying the dip, OG #Whales are moving their bitcoins from early cycle.

• • •
Missing some Tweet in this thread? You can try to
force a refresh


