
🐻♉️↗️↘️↔️⚠️🚩🔺🔻🧮 💰
#CPI Preview
1/10
One 🤡 calls it #macrotourism, but #CPI and #FOMC policy response are the single most important issues to macro investors today.
Let’s dig into the 🧮!
#CPI Preview
1/10
One 🤡 calls it #macrotourism, but #CPI and #FOMC policy response are the single most important issues to macro investors today.
Let’s dig into the 🧮!
2/10
At his Brookings Institute speech at the end of November, Powell broke core #inflation into 3 components:
a) goods inflation
b) housing services inflation
c) services, ex-housing = wages
At his Brookings Institute speech at the end of November, Powell broke core #inflation into 3 components:
a) goods inflation
b) housing services inflation
c) services, ex-housing = wages
2a/10
Goods inflation is clearly coming down along with inputs into that equation.
$COOPER +10.65% in November is nonetheless -13% YTD
Goods inflation is clearly coming down along with inputs into that equation.
$COOPER +10.65% in November is nonetheless -13% YTD

2b/10
$LUMBER is -64% YTD
$LUMBER is -64% YTD

2c/10
$COTTON -28% YTD
$COTTON -28% YTD

2d/10
The cost of transporting those goods from places far away have also fallen dramatically, with the #FBX -73.4% YTD
Chart: Freightos Baltic Index (FBX)
The cost of transporting those goods from places far away have also fallen dramatically, with the #FBX -73.4% YTD
Chart: Freightos Baltic Index (FBX)

2e/10
Used car 🚗 prices, an early driver of inflation, are now little changed on a y/y and m/m basis per #MainheimIndex
Used car 🚗 prices, an early driver of inflation, are now little changed on a y/y and m/m basis per #MainheimIndex

3a/10
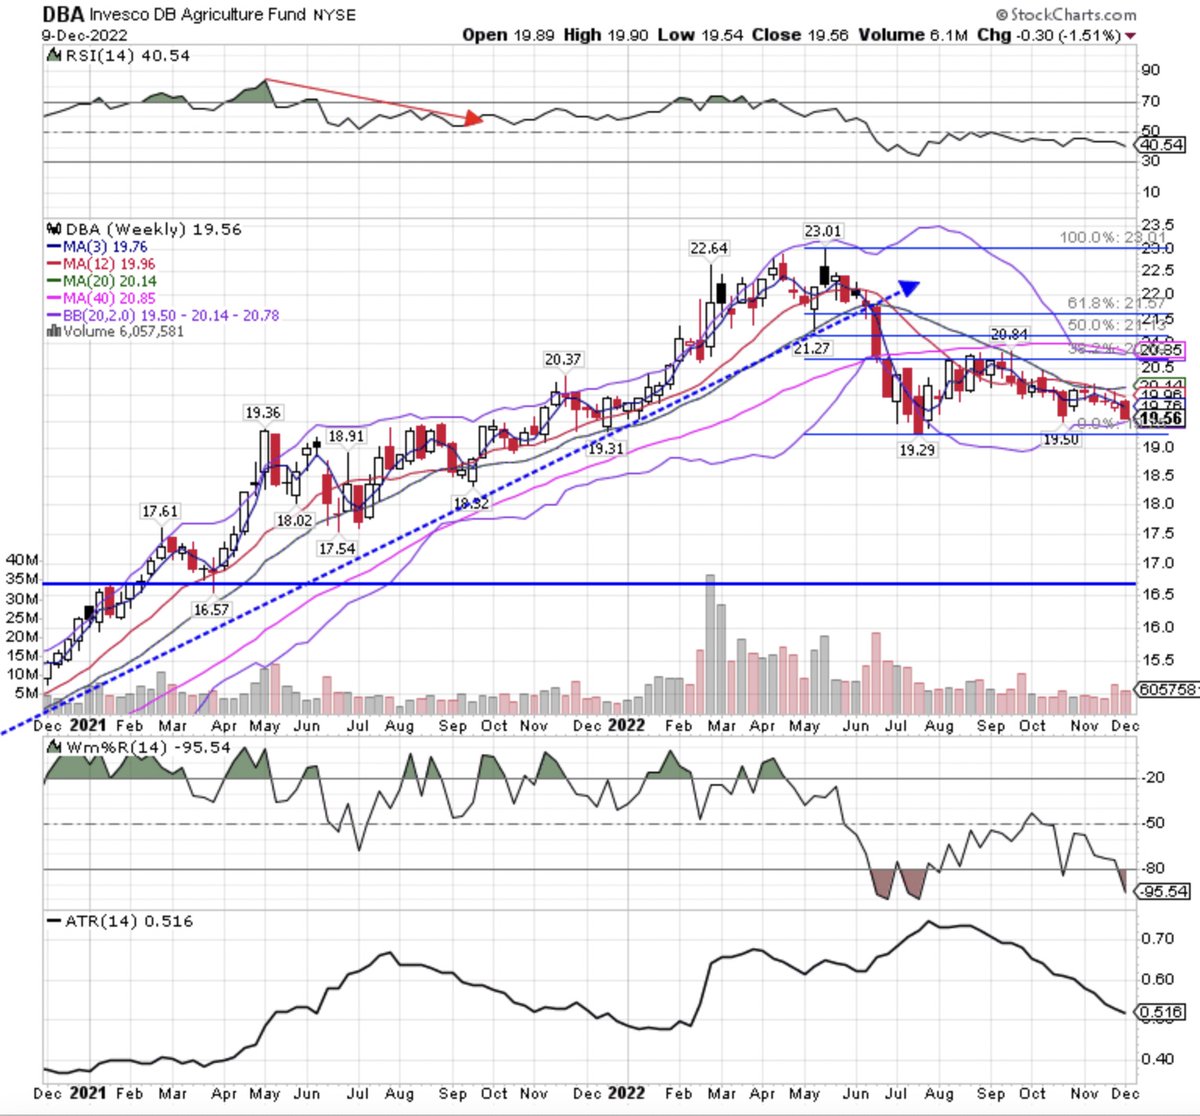
Food and energy prices have also fallen significantly since the June/July peak
Chart: 🌾$DBA -1.0% YTD
Food and energy prices have also fallen significantly since the June/July peak
Chart: 🌾$DBA -1.0% YTD
3b/10
Can this be true? The cost of fueling your vehicle is down significantly
Chart: ⛽️ $GASO -7.4% YTD and crashing 📉
Can this be true? The cost of fueling your vehicle is down significantly
Chart: ⛽️ $GASO -7.4% YTD and crashing 📉

4/10
Rents, a proxy for shelter costs which comprise 42% of the #CPI and a lagging indicator among lagging indicators, are +7.8% y/y and -0.97% in November.
Chart: Rent Report for November from Rent.com
Rents, a proxy for shelter costs which comprise 42% of the #CPI and a lagging indicator among lagging indicators, are +7.8% y/y and -0.97% in November.
Chart: Rent Report for November from Rent.com

5/10
But here’s the problem - #wages
To quote Powell, "nominal wages have been growing at a pace well above what would be consistent with 2 percent inflation over time."
But here’s the problem - #wages
To quote Powell, "nominal wages have been growing at a pace well above what would be consistent with 2 percent inflation over time."
5a/10
The market wobbled on December 2 with the release of the November payroll report
Chart: Wages accelerated to +5.1% y/y in the November #NFP report
The market wobbled on December 2 with the release of the November payroll report
Chart: Wages accelerated to +5.1% y/y in the November #NFP report

5b/10
The market wobbled again on Friday with the release of #PPI +7.4%.
The area of specific concern: the index for services for intermediate demand increased 6.7%, the largest 12- month advance since rising 7.9 percent in May.
Service = #wages
The market wobbled again on Friday with the release of #PPI +7.4%.
The area of specific concern: the index for services for intermediate demand increased 6.7%, the largest 12- month advance since rising 7.9 percent in May.
Service = #wages
6/10
In advance of #PPI, $TNX had declined -81 bps from the October peak, abruptly reversed course on Friday, rising 17 bps
Chart: $TNX holding trend support
In advance of #PPI, $TNX had declined -81 bps from the October peak, abruptly reversed course on Friday, rising 17 bps
Chart: $TNX holding trend support

6a/10
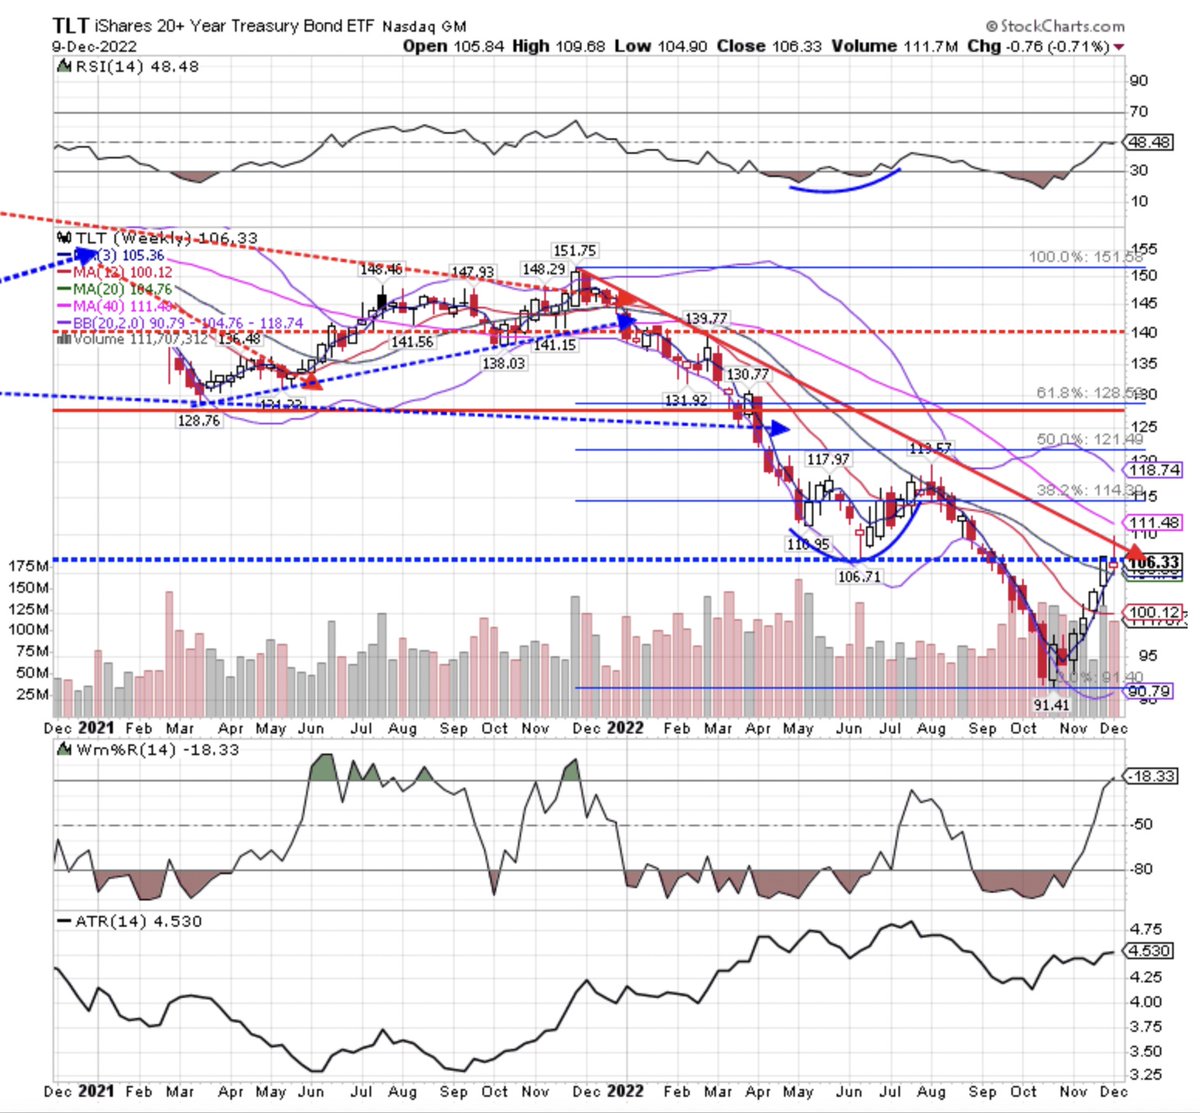
$TLT, effectively, the inverse of $TNX, had rising 17% off the October bottom, but gave back 3% on Thursday and Friday
Chart: $TLT stopped in its tracks upon the release of #PPI
$TLT, effectively, the inverse of $TNX, had rising 17% off the October bottom, but gave back 3% on Thursday and Friday
Chart: $TLT stopped in its tracks upon the release of #PPI
7/10
Equity indices, which rose in concert with $TLT (0.2 correlation), gave back some of the October - November gains.
Chart: $SPX -3.37% and a SELL signal on the weekly chart.
Equity indices, which rose in concert with $TLT (0.2 correlation), gave back some of the October - November gains.
Chart: $SPX -3.37% and a SELL signal on the weekly chart.

8/10
Positive vanna and charm flows from $1 T in notional options expiration this coming Friday were no match for the macro forces (rising wages and persistent inflation) at play.
Chart: $VIX +377 bps on the week a signaling BUY
Positive vanna and charm flows from $1 T in notional options expiration this coming Friday were no match for the macro forces (rising wages and persistent inflation) at play.
Chart: $VIX +377 bps on the week a signaling BUY

9/10
With wages continuing ↗️, there is more work to do, per Powell:
"Policies to support labor supply are not the domain of the Fed: Our tools work principally on demand. Job growth remains far in excess of the pace needed to accommodate population growth over time (100K/m)."
With wages continuing ↗️, there is more work to do, per Powell:
"Policies to support labor supply are not the domain of the Fed: Our tools work principally on demand. Job growth remains far in excess of the pace needed to accommodate population growth over time (100K/m)."
9a/10
Notably, both the market and the Treasury have been fighting the Fed.
In particular, Yellen had projected a TGA build to 700B by 12/31. Instead, she has released over -79B from the account last week and no where near 700B.
Chart: TGA to 432B
Notably, both the market and the Treasury have been fighting the Fed.
In particular, Yellen had projected a TGA build to 700B by 12/31. Instead, she has released over -79B from the account last week and no where near 700B.
Chart: TGA to 432B

10/10
#CPI headline consensus = +7.3% y/y down from +7.3% in October
#CPI core consensus = +6.1% y/y down from +6.3% in October
The 🔑 number to watch is core #CPI, which will remain 🛗 and perhaps higher than consensus.
#CPI headline consensus = +7.3% y/y down from +7.3% in October
#CPI core consensus = +6.1% y/y down from +6.3% in October
The 🔑 number to watch is core #CPI, which will remain 🛗 and perhaps higher than consensus.
10a/10
With the market and the Treasury fighting 🥊 the Fed, expect a hawkish 🦅 50 BPS hike on Wednesday.
Likely, that is NOT priced in
You know what to do
Have a super profitable 💰 week!
With the market and the Treasury fighting 🥊 the Fed, expect a hawkish 🦅 50 BPS hike on Wednesday.
Likely, that is NOT priced in
You know what to do
Have a super profitable 💰 week!
Here's an awesome, much more comprehensive 🧵 on #wages
https://twitter.com/BobEUnlimited/status/1601596993876656128?s=20&t=rvUAaG9TTHtsHOB1Yf9LmQ
• • •
Missing some Tweet in this thread? You can try to
force a refresh


