
🐻♉️↗️↘️↔️⚠️🚩🔺🔻🧮 💰
Global Macro Review 🧵
1/14
Much will be written about 2022 full-year performance, so let’s take a look at the last 3 months of the year to see if we can discern anything from a price momentum perspective.
(T) = Trend = 3-month price momentum
Global Macro Review 🧵
1/14
Much will be written about 2022 full-year performance, so let’s take a look at the last 3 months of the year to see if we can discern anything from a price momentum perspective.
(T) = Trend = 3-month price momentum
2/14
The $USD -7.86% peaked in September, providing much needed relief for risk assets around the world.
Chart: $USD -2.48% in December sits at critical trend line support with all major trend levels in bearish territory.
A close below 102 opens up 99. Mean revert or die.
The $USD -7.86% peaked in September, providing much needed relief for risk assets around the world.
Chart: $USD -2.48% in December sits at critical trend line support with all major trend levels in bearish territory.
A close below 102 opens up 99. Mean revert or die.

3/14
After a modest pull-back in November, the $UST10Y resumed its upward trajectory in December, rising +20 bps to 3.88%.
Chart: $UST10Y - If you believe BOTH growth and inflation are slowing, then this thing needs to put in a big lower higher between here and 3.977%.
After a modest pull-back in November, the $UST10Y resumed its upward trajectory in December, rising +20 bps to 3.88%.
Chart: $UST10Y - If you believe BOTH growth and inflation are slowing, then this thing needs to put in a big lower higher between here and 3.977%.

4/14
Metals led commodities higher in Q4:
$SILVER +26.27%
$PLAT +26.05%
$COPPER +11.73%
$GOLD +9.22%
Chart: SILVER +10.38% in December, bolstered by a weak $USD, which is the key to continuation or reversion.
Metals led commodities higher in Q4:
$SILVER +26.27%
$PLAT +26.05%
$COPPER +11.73%
$GOLD +9.22%
Chart: SILVER +10.38% in December, bolstered by a weak $USD, which is the key to continuation or reversion.

5/14
Among hydrocarbons, it was a tale of two gases
$GASO +4.64$
$NATGAS -33.97%
$WTIC +0.97%
Chart: $NATGAS -35.5% in December alone, but still +19.84% YTD with implications for utility rates and industrial production.
Among hydrocarbons, it was a tale of two gases
$GASO +4.64$
$NATGAS -33.97%
$WTIC +0.97%
Chart: $NATGAS -35.5% in December alone, but still +19.84% YTD with implications for utility rates and industrial production.

6/14
Grains were a mixed bag in Q4
$SUGAR +13.22%
$SOYB +11.67%
$CORN +0.15%
$WHEAT -14.05%
Chart: $DBA +0.65% in Q4 reflects a composite of agriculture commodities, which are under control.
Grains were a mixed bag in Q4
$SUGAR +13.22%
$SOYB +11.67%
$CORN +0.15%
$WHEAT -14.05%
Chart: $DBA +0.65% in Q4 reflects a composite of agriculture commodities, which are under control.

7/14
$SPX +7.08% outperformed both $IWM +5.72% and $COMPQ -6.77% in Q4.
Chart: $SPX -5.9% in December encountering serious overhead into the new year
$SPX +7.08% outperformed both $IWM +5.72% and $COMPQ -6.77% in Q4.
Chart: $SPX -5.9% in December encountering serious overhead into the new year

8/14
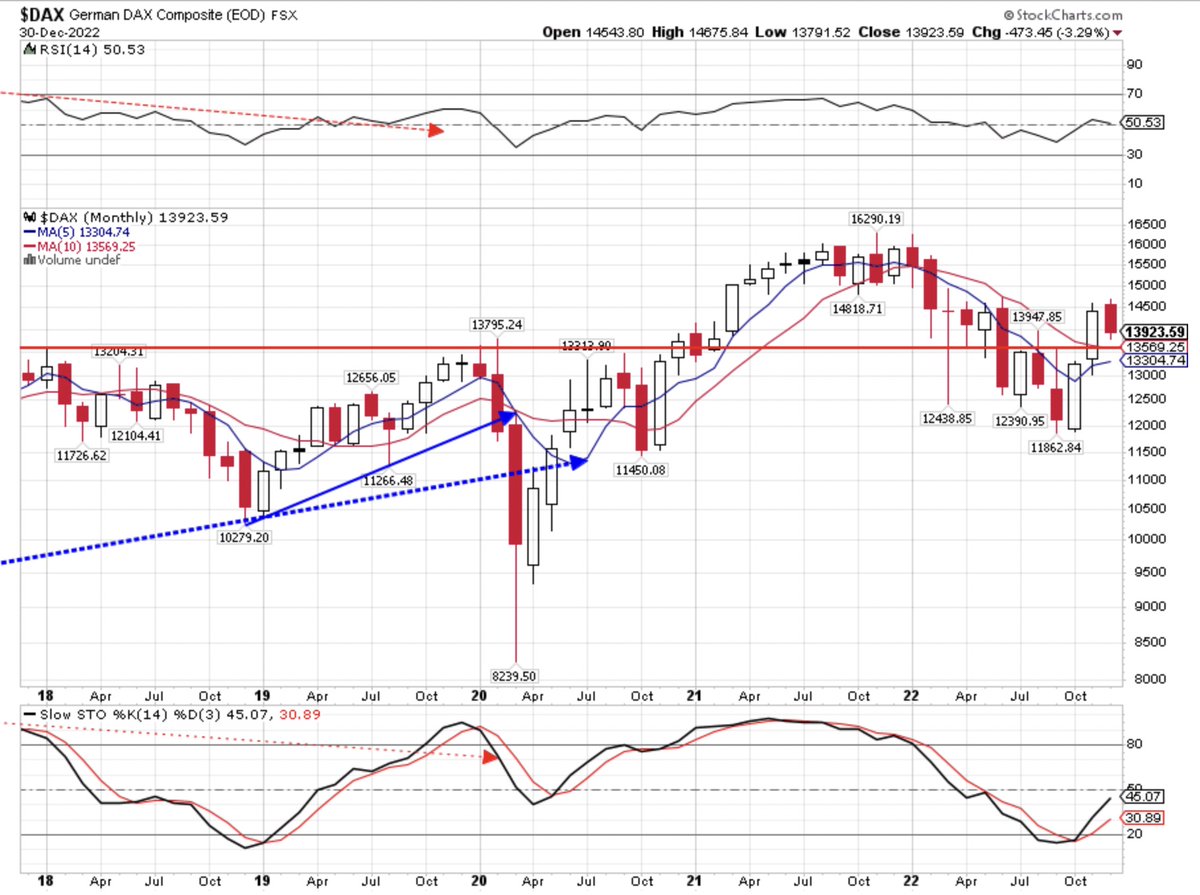
Both the $DAX +14.93% and the $CAC +12.35% outperformed the $SPX in Q4
Chart: The $DAX gave back -3.29% in December as Europe surprised to the upside in Q4, even as the #ECB tightened into #recession
Both the $DAX +14.93% and the $CAC +12.35% outperformed the $SPX in Q4
Chart: The $DAX gave back -3.29% in December as Europe surprised to the upside in Q4, even as the #ECB tightened into #recession
9/14
After a nasty -48%, 2-year drop, $HSI +14.86% in Q$ led Asia higher with $KOSPI +3.75%, $SSEC +2.14%, and $NIKK +0.61%
Chart: Did $HSI +6.37% in December sniff out the end of #CovidZero?
After a nasty -48%, 2-year drop, $HSI +14.86% in Q$ led Asia higher with $KOSPI +3.75%, $SSEC +2.14%, and $NIKK +0.61%
Chart: Did $HSI +6.37% in December sniff out the end of #CovidZero?

10/14
Among US Sectors only $XLY -9.33% was negative over (T) duration
Outperformance came from:
$XLE +21.45%
$XLI 15.55%
$XLB +14.07%
$XLF +12.65%
$XLV + 12.17%
$XLP +11.72%
Chart: $XLV -0.96% over the 4weeks (t) has held up better than other sectors. Can we get close > 140?
Among US Sectors only $XLY -9.33% was negative over (T) duration
Outperformance came from:
$XLE +21.45%
$XLI 15.55%
$XLB +14.07%
$XLF +12.65%
$XLV + 12.17%
$XLP +11.72%
Chart: $XLV -0.96% over the 4weeks (t) has held up better than other sectors. Can we get close > 140?

11/14
Value outperformed growth by a wide margin
$SPYV +12.76%
$SPYG +1.32%
Chart: $SPYV -3.88% pulled back less than $SPYG -7.59% in December. Looking for a close > 41 to stay long.
Value outperformed growth by a wide margin
$SPYV +12.76%
$SPYG +1.32%
Chart: $SPYV -3.88% pulled back less than $SPYG -7.59% in December. Looking for a close > 41 to stay long.

12/14
Low beta provided 190 bps in beta over high beta
$SPLV +10.5%
$SPHB +8.61%
Chart: $SPLV gave back -1.17% in December compared with $SPHB -8.55%
Low beta provided 190 bps in beta over high beta
$SPLV +10.5%
$SPHB +8.61%
Chart: $SPLV gave back -1.17% in December compared with $SPHB -8.55%

13/14
Momentum is favoring a weaker $USD and firmer yields, commodities, and equities with international indices outperforming $SPX.
Value leads growth by a wide margin and low beta is trumping high beta with energy, industrials, and materials at the top of the board.
Momentum is favoring a weaker $USD and firmer yields, commodities, and equities with international indices outperforming $SPX.
Value leads growth by a wide margin and low beta is trumping high beta with energy, industrials, and materials at the top of the board.
14/14
Were it not for the massive liquidity drain (Fed balance sheet, TGA, and reverse repo) and the renewed rise in yields, a healthy dose of risk assets might be prescribed.
For now, the market messages are mixed.
A look ahead to Q1 2023 tomorrow.
Cheers! 🍻
Were it not for the massive liquidity drain (Fed balance sheet, TGA, and reverse repo) and the renewed rise in yields, a healthy dose of risk assets might be prescribed.
For now, the market messages are mixed.
A look ahead to Q1 2023 tomorrow.
Cheers! 🍻
• • •
Missing some Tweet in this thread? You can try to
force a refresh


