Jeff Gilchrist Profile picture
Jan 6, 2023 39 tweets 12 min read Read on X
How #COVID actively suppresses and evades your immune system [Part 1]

This thread highlights multiple methods that the virus uses to help keep reinfecting people including MHC-I and interferon suppression, evasion of Natural Killer (NK) cells, and reprogramming of monocytes.🧵1/ AI generated image of immun...
An unrolled one-page web view for this long thread that may be easier to read or share can be found here ( ). 2/
COVID has been doing this to varying degrees since the beginning which further reinforces that a vaccine only policy is not enough to stop the cycle of sickness, long term disability, and death. 3/
Some people have the privilege of clean drinking water so they do not have to boil their own water for it to be safe because the infrastructure was put in place to clean the water. 4/
We need similar changes in infrastructure now to provide clean indoor air for people, not just from pathogens but from other pollutants as well ( ). 5/
First some simplified background info, CD8+ T-cells and Natural Killer (NK) cells are both immune system cells with similar goals to kill (cytotoxic) infected and transformed cells but their recognitions and memory mechanisms are very different ( ncbi.nlm.nih.gov/pmc/articles/P… ). 6/
Cells express MHC-I molecules on their surface as a surface recognition element to signal the cell's physiological state to immune cells such as T-cells and NK cells ( pubmed.ncbi.nlm.nih.gov/11256571/ ). 7/
When a cell is infected for example, it will present parts of the virus (antigen) on the surface using MHC-I as a way to alert the immune system for help. 8/
The T-cells look for specific antigens they have been "trained" to find and will bind to a cell that matches and then activate their response such as killing the cell. 9/ Diagram showing activating ...
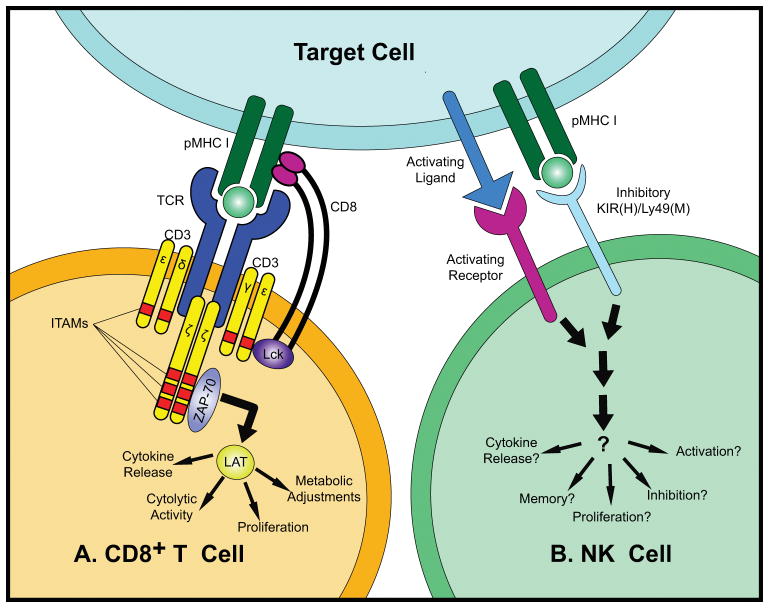
With NK cells however, there is no single dominant receptor for NK cell recognition but they express an array of innate activating and inhibitory receptors to sense their environment and respond to alterations caused by infections, stress, and transformation. 10/ Diagram showing activating ...
Innate immunity cells are the first responders to sites of infection and NK cells are much quicker to establish a robust response than CD8+ T-cells ( ncbi.nlm.nih.gov/pmc/articles/P…). NK cells can also recruit T-cells and other adaptive responders to the sites of infection. 11/
You can learn more watching this @VirusesImmunity "Immunology 101 for non-immunologists video" ( ) and @Kurz_Gesagt "How your immune system actually works video" ( ). 12/
Now that you have a little background, how does the COVID virus try to avoid the immune system? The newer Omicron variants exhibit an even greater ability to suppress surface MHC-I expression in cells the virus infects ( biorxiv.org/content/10.110… ). H/T: @VirusesImmunity 13/
That means CD8+ T-cells can't as easily "dock" with the infected cell and kill it. The study found multiple variants BA.1, BA.2.12.1, BA.4, and XAF all had significantly higher MHC-I suppression than the original WA1 strain but had no impact in MHC-I on the surrounding cells. 14/ Graph showing Increased sup...
This allows infected cells to be more "invisible" to CD8+ T-cells that otherwise would have been able to find and destroy the cell which lets the virus continue to replicate. 15/
Another study found that COVID virus also suppresses the danger signals that are supposed to help NK immune cells recognize (with their NKG2D receptor) and kill infected cells ( cell.com/cell-reports/f… ). H/T: @m_janelee 16/ Diagram showing NK immune c...
COVID virus causes NK cells to exhibit poor cytotoxic (killing) responses to infected cells and instead preferentially target and kill uninfected bystander cells. 17/
The researchers found that NK cells are actually really good at killing COVID infected cells before the virus has had a chance to replicate and suppress NKG2D-L compared to 48 hours after infection ( ). 18/ Diagram showing NK immune c...
The part of the virus that suppresses NKG2D-L to prevent NK cells from killing the cells they infect is Non-Structural Protein 1 (Nsp1). 19/
The researchers found that just putting Nsp1 inside the cell without any other part of the virus was enough to both suppress NKG2D-L and stop NK cells from killing it. 20/
When they tried using various other components of the virus instead, the NK cells kept killing the cells, with most increasing the chance of the cell being killed. 21/
This is yet another way for COVID to get around the immune system with methods to make infected cells more "invisible" to both immune CD8+ T-cells and NK cells. 22/
The researchers point out that the Nsp1 protein in the virus is highly conserved and needed for viral replication so it may make a good target for therapeutics against other families of coronaviruses as well. 23/
Due to genetic variation about 4% of a population studied lacked the NKG2C receptor on NK cells and 30% have the receptor only partially available which had a significant impact on the development of severe COVID infections ( gimjournal.org/article/S1098-… ). H/T: @0bj3ctivity 24/
The study found people without the NK receptor or having a partial receptor were significantly overrepresented in hospitalized patients, particularly in patients requiring intensive care compared to those with mild symptoms. 25/
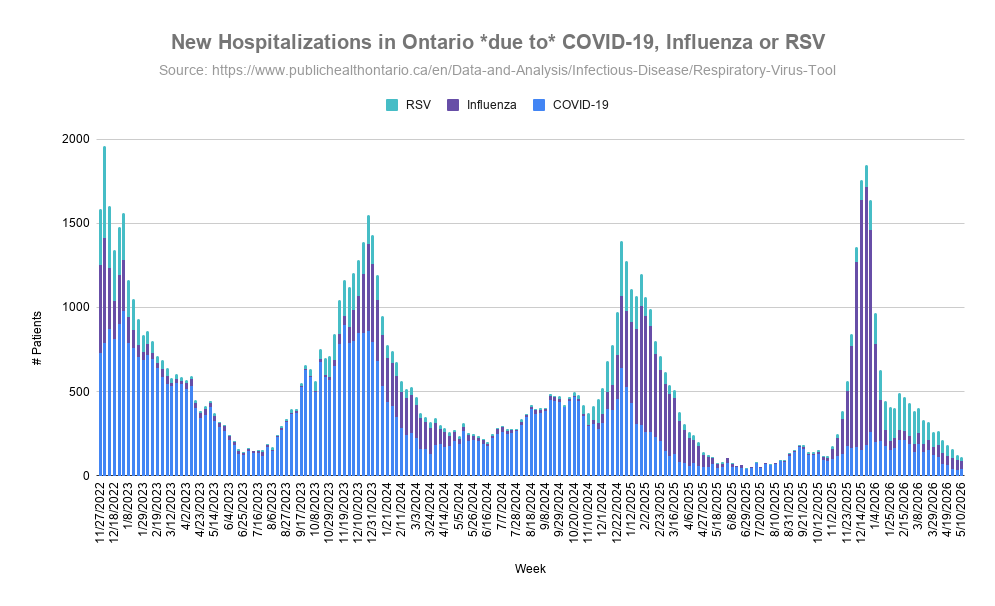
These multiple methods of immune suppression and evasion by COVID help explain why viral loads can get high enough again in people that are previously infected/vaccinated to become contagious and transmit the virus to others before the body can get the infection under control.26/
Part 2 will look at how the COVID virus reprograms innate immune functions such as white blood cells (monocytes) that increase the risk of blood clots and suppresses innate immunity to other viruses and bacteria increasing risk of secondary infections. 27/
To add some context to tweet 26/ for people who are vaccinated or previously infected, even though your immune system has seen a COVID variant before and you already have T-cells that can recognize the virus... 28/
...the new variant you are exposed to can suppress the mechanism that those T-cells (and NK cells) use to identify and kill COVID infected cells giving the virus time to replicate a lot before other parts of the immune system notice and start fighting off the virus. 29/
That is why people can't "vax and relax" forgoing all other precautions because exposure again can still give the new virus infection a chance to replicate enough to cause trouble in your own body and also potentially infect other people too. 30/
Some people are asking, why does this immune suppression happen to people who have been vaccinated and never infected before as well as people who have been infected already? Click "Show replies" 👇 to continue. 31/
It is happening to all people because the mechanism to evade and suppress the immune system that I describe in this thread is the ability of the virus itself to turn off/reduce the ability of CD8+ T-Cells and NK immune cells from detecting the cells it has infected. 32/
This allows the virus to fly under the radar, vaccinated or not. If you get infected, among many things, your body develops T-cells that recognize the virus Spike protein. When you get vaccinated, you also develop T-cells but without getting attacked by a functional virus. 33/
When you get infected again (or first time after vaccination) those T-Cells are trying to specifically hunt down and kill COVID infected cells it already learned about but they can't easily find them and kill them because... 34/
...the new virus infection is blocking the ability for the T-cell to do that. So this happens in both scenarios. 35/
Without needing to know about the COVID virus specifically, immune NK cells also try to hunt down and kill any infected cells, but again COVID developed a way to prevent NK cells from finding them and doing this effectively. 36/
The evasion is a property of the virus itself so it happens with all people who get exposed, the virus hides from the immune system whether you are vaccinated or not, previously infected or not. 37/
Think of the COVID virus as a Ninja, it can sneak into your castle and hide even if the guards have seen Ninja before and defeated them. The guards can't fight them unless they know they are there in the first place and where to find them. 38/ AI generated image showing ...
Part 2 which looks at how mild and moderate #COVID infection reprograms white #blood cells (#monocytes) to reduce #innate #immune functions and how it evades the mucus layer in our #nose is now available ( ). 39/

• • •

Missing some Tweet in this thread? You can try to force a refresh
 

Keep Current with Jeff Gilchrist

Jeff Gilchrist Profile picture

Stay in touch and get notified when new unrolls are available from this author!

Read all threads

This Thread may be Removed Anytime!

PDF

Twitter may remove this content at anytime! Save it as PDF for later use!

Try unrolling a thread yourself!

how to unroll video
  1. Follow @ThreadReaderApp to mention us!

  2. From a Twitter thread mention us with a keyword "unroll"
@threadreaderapp unroll

Practice here first or read more on our help page!

More from @jeffgilchrist

Jul 1
*** Ontario Variant Update | July 01 ***

In Ontario, the XFG.* "Stratus" family regained the lead at 42% while the NB.1.8.1.* "Nimbus" variant family decreased to 33% of sequenced genomes from COVID tests. 🧵1/

#Ontario #COVID #Variant #Stratus #BA.3.2 #Cicada #Nimbus This multi-line chart tracks the lineage frequency of various COVID-19 variant families in Ontario over time, based on sequenced genome samples. The graph illustrates the changing prevalence of specific variant families, showing how different lineages compete and evolve as the dominant strains within the province.
The BA.3.2 "Cicada" family increased to 19% but the low # of sequences means results are not very representative. 2/
Ontario released another month of sequencing data by age and we continue to see high ratios of Cicada in children with another 5 BA.3.2.* sequences out of 18 new child sequences ( ). 3/publichealthontario.ca/-/media/docume…
Read 24 tweets
Jun 30
*** Ontario Virus Update | June 30 ***

Hospitalizations due to COVID have increased from 9 to 18 in the last update. Influenza hospitalizations remained stable at 13 and RSV increased from 3 to 5 so not quite finished for the season yet for those two.🧵1/

#Ontario #Virus #COVID This stacked bar chart displays weekly new hospitalizations in Ontario specifically attributed to COVID-19, Influenza, and RSV. The data tracks the fluctuating volume of patients over time, highlighting seasonal surges and the relative contribution of each respiratory virus to the overall healthcare burden.
Looking at age groups, those age 75+ and 65-74 tied for having the highest rates of hospitalization due to COVID and both increased since last update. The only other age group with hospitalizations was 50-64, no children this past update. 2/ This multi-line graph tracks the weekly rate of hospital admissions per 100,000 population in Ontario across various age demographics. The visualization highlights shifting clinical trends over time, showing the weekly fluctuations and comparative hospital burden between different age categories ranging from infants to seniors aged 75 and older.
For this epidemiological year 2025/2026 so far, adults 75+ had the highest rate of COVID hospital admissions, followed by age 65-74 and then age 0-4 in third place. Young children 0-4 had hospitalization rates twice as high as fourth place group age 50-64. 3/ This side-by-side bar chart displays the rate of hospital admissions per 100,000 population in Ontario for the 2025/2026 year-to-date epidemiological year. The graph breaks down the data across six age groups, illustrating a clear progressive trend where hospital admission rates increase significantly with age, peaking sharply in the 75+ demographic except for children age 0-4 which have the third highest rate.
Read 12 tweets
Jun 1
*** Ontario Virus Update | June 1 ***

Hospitalizations due to COVID have decreased from 38 to 21 in the last update. Influenza hospitalizations decreased from 51 to 44 and RSV decreased from 20 to 18 so moving in the right direction but still not finished for the season yet. 1/ This stacked bar chart displays weekly new hospitalizations in Ontario specifically attributed to COVID-19, Influenza, and RSV. The data tracks the fluctuating volume of patients over time, highlighting seasonal surges and the relative contribution of each respiratory virus to the overall healthcare burden.
Looking at age groups, those age 75+ had the highest rates of hospitalization due to COVID but decreased since last update. Tied for second place are the 0-4 and 65-74 age groups. 2/ This 100% stacked area chart illustrates the weekly proportion of COVID-19 hospital admissions per 100,000 population in Ontario across different age groups. The graph visualizes how the relative distribution of hospitalizations shifts over time among demographics ranging from infants to seniors aged 75 and older.
COVID case rates decreased across most age groups this past update except for age <1 which had a significant increase and almost matching the same levels as age 80+. The 1-4 and 60-79 age groups currently have the same rates. 3/ This multi-line graph tracks the weekly rate of COVID-19 cases per 100,000 population in Ontario, categorized by various age groups from infants to seniors aged 80 and older. The data trends highlight the fluctuations in infection rates across different demographics over the year.
Read 10 tweets
May 30
Filtering the air may help prevent your own infection from becoming more severe

If everyone in a household becomes infected with the same virus, does it help to isolate from each other and can you be a danger to yourself? Read on to find out...🧵1/

#AirQuality #IAQ #Ventilation This grouped bar chart, titled "COVID Positive Abnormal Chest CT by Air Quality Setting", displays the percentage of abnormal chest CT scans among COVID-positive patients across three different tiers of air quality control. The graph compares overall and asymptomatic cases, illustrating a clear downward trend in the percentage of abnormal scans as air filtration and ventilation efficiency improve from household levels to high-efficiency aerosol control.
An interesting hypothesis-generating study was published recently that asked if an infected person's condition can become even worse by re-inhaling their own virus particles ( ). 2/sciencedirect.com/science/articl…
Is a transition from a milder upper respiratory tract infection (runny nose, sore throat) to a more severe lower respiratory tract infection like pneumonia is significantly driven by the physical mechanism of inhaling virus containing aerosols deep into the lungs? 3/
Read 26 tweets
May 24
*** Ontario Virus Update | May 24 ***

Hospitalizations due to COVID have increased from 34 to 38 in the last update. Influenza hospitalizations decreased from 57 to 51 and RSV decreased from 33 to 20. 🧵1/

#Ontario #Virus #COVID #RSV #Influenza #Hospital This stacked bar chart displays weekly new hospitalizations in Ontario specifically attributed to COVID-19, Influenza, and RSV. The data tracks the fluctuating volume of patients over time, highlighting seasonal surges and the relative contribution of each respiratory virus to the overall healthcare burden.
Looking at age groups, those age 75+ had the highest rates of hospitalization due to COVID but decreased since last update. Second place is age 65-74 which increased, and third place is age 0-4 which also increased. 2/ This 100% stacked area chart illustrates the weekly proportion of COVID-19 hospital admissions per 100,000 population in Ontario across different age groups. The graph visualizes how the relative distribution of hospitalizations shifts over time among demographics ranging from infants to seniors aged 75 and older.
COVID case rates were fairly stable across age groups this past update except for age 80+ which had a significant decrease but still maintain the highest rates. The 0-4 and 60-79 age groups currently have similar rates. 3/ This multi-line graph tracks the weekly rate of COVID-19 cases per 100,000 population in Ontario, categorized by various age groups from infants to seniors aged 80 and older. The data trends highlight the fluctuations in infection rates across different demographics over the year.
Read 10 tweets
May 10
*** Ontario Variant Update | May 10 ***

In Ontario, the NB.1.8.1.* "Nimbus" variant family shot to 74.7% of sequenced genomes from COVID tests while the XFG.* "Stratus" family dropped to 15.8% and the BA.3.2 "Cicada" family decreased below 10% again.🧵1/
#Ontario #COVID #Variant This multi-line chart tracks the lineage frequency of various COVID-19 variant families in Ontario over time, based on sequenced genome samples. The graph illustrates the changing prevalence of specific variant families, showing how different lineages compete and evolve as the dominant strains within the province.
Ontario released another month of sequencing data by age and we continue to see high ratios of Cicada in children with another 51 BA.3.2.2.* sequences out of 617 new sequences ( ). 2/publichealthontario.ca/-/media/docume…
With 126 Cicada sequences from 1,828 total, we see children still have the highest proportion which decreases after age 5-11 as age increases with significant drops from age 60+. 3/ This bar chart illustrates the percentage of the BA.3.2.* Cicada COVID-19 variant lineage among different age groups in Ontario over a designated time period. The graph visualizes the relative prevalence of the lineage across demographics, highlighting how the variant is distributed from young children to seniors aged 80 and older.
Read 11 tweets

Did Thread Reader help you today?

Support us! We are indie developers!


This site is made by just two indie developers on a laptop doing marketing, support and development! Read more about the story.

Become a Premium Member ($3/month or $30/year) and get exclusive features!

Become Premium

Don't want to be a Premium member but still want to support us?

Make a small donation by buying us coffee ($5) or help with server cost ($10)

Donate via Paypal

Or Donate anonymously using crypto!

Ethereum

0xfe58350B80634f60Fa6Dc149a72b4DFbc17D341E copy

Bitcoin

3ATGMxNzCUFzxpMCHL5sWSt4DVtS8UqXpi copy

Thank you for your support!

Follow Us!

:(