We traders, always make our trading so complicated & in live market that results into losses.
Simple range breakout strategy to catch Index trades.
A Thread 🧵
(1/14)
#StockMarket #trading @kuttrapali26
Simple range breakout strategy to catch Index trades.
A Thread 🧵
(1/14)
#StockMarket #trading @kuttrapali26
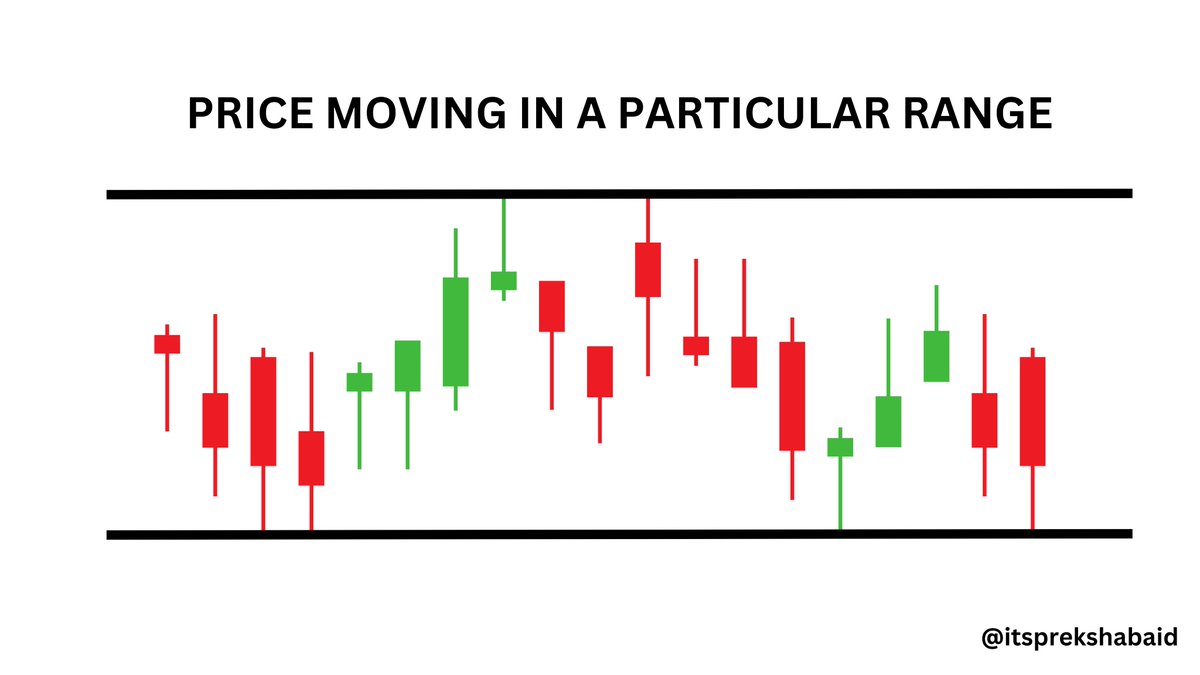
✨What is range bound market?
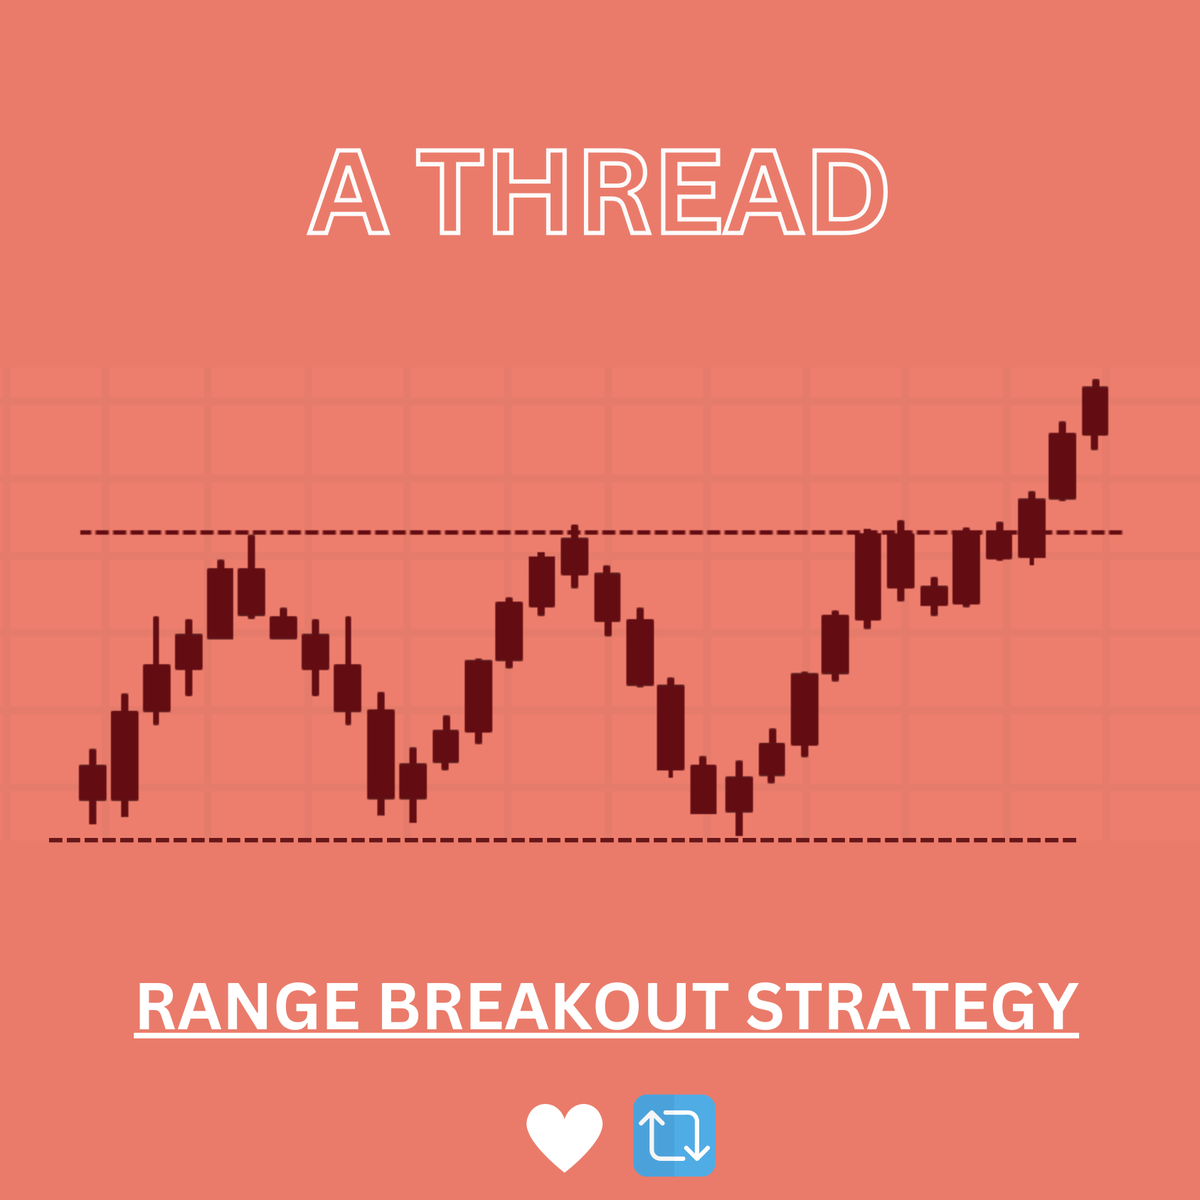
When the stock prices generally flow back and forth near the old highs and then fall back to the recent lows.
When we mark such highs and lows, we find a range, and when the price move between that range, it can be termed as range bound. (2/14)
When the stock prices generally flow back and forth near the old highs and then fall back to the recent lows.
When we mark such highs and lows, we find a range, and when the price move between that range, it can be termed as range bound. (2/14)
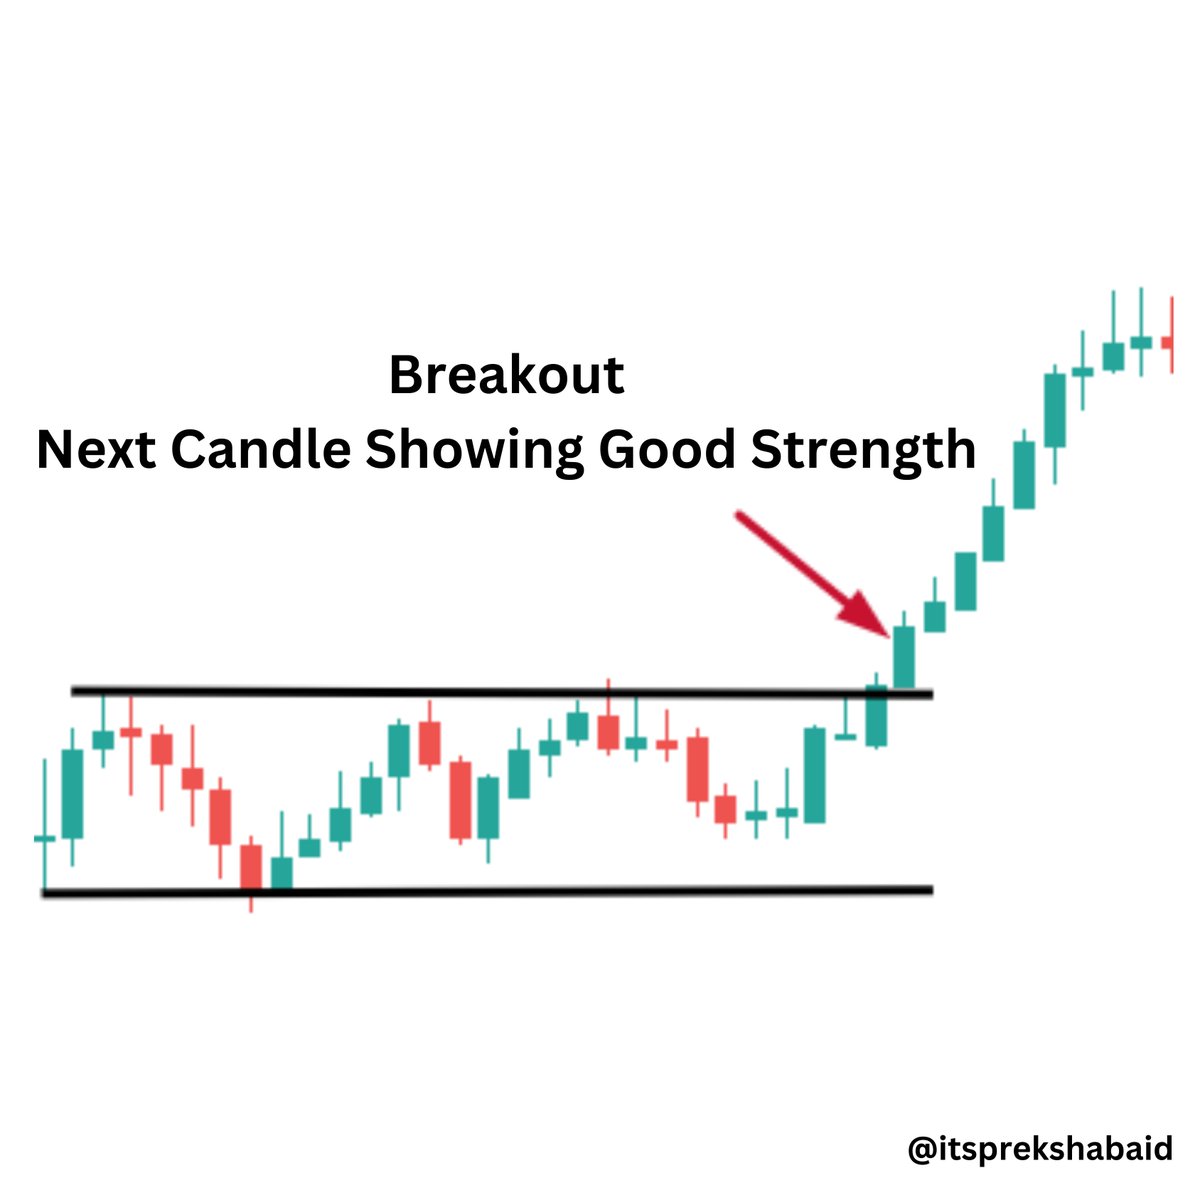
✨What is Range breakout?
When the price breaks the range which we marked earlier, it means now the price is no more trading conjestion area, then it can be termed as range breakout.
After such range breakout, we can see good price movement in that particular direction. (3/14)
When the price breaks the range which we marked earlier, it means now the price is no more trading conjestion area, then it can be termed as range breakout.
After such range breakout, we can see good price movement in that particular direction. (3/14)

• Usually after a good move index turns rangebound and due to that we get several opportunities to trade range breakout.
• In live market we have to mark such range with help of horizontal or trendline and wait for the range to break. (4/14)
• In live market we have to mark such range with help of horizontal or trendline and wait for the range to break. (4/14)
Banknifty
•Timeframe : 5 Min
•Criteria : At least 12-15 Candles should be within same range
We can also use it in #Nifty or any other stocks. (5/14)
•Timeframe : 5 Min
•Criteria : At least 12-15 Candles should be within same range
We can also use it in #Nifty or any other stocks. (5/14)
✨Entry :
Once the breakout candle close above the range
•Make sure next candle is showing good strength
•Next candle should not be a weak candle/ It should not come in the range again
•Take entry once the above criteria fulfil. (6/14)
Once the breakout candle close above the range
•Make sure next candle is showing good strength
•Next candle should not be a weak candle/ It should not come in the range again
•Take entry once the above criteria fulfil. (6/14)
Exit :
Two ways for exit
•Calculate the range of the consolidation area (rangebound area), after breakout we can see the movement similar to that range.
•Mark strong resistance areas in the chart , use them as target.
👉🏻I always prefer the second one. (8/14)
Two ways for exit
•Calculate the range of the consolidation area (rangebound area), after breakout we can see the movement similar to that range.
•Mark strong resistance areas in the chart , use them as target.
👉🏻I always prefer the second one. (8/14)
Examples:
#Banknifty 5 min chart : 13-Jan-2023
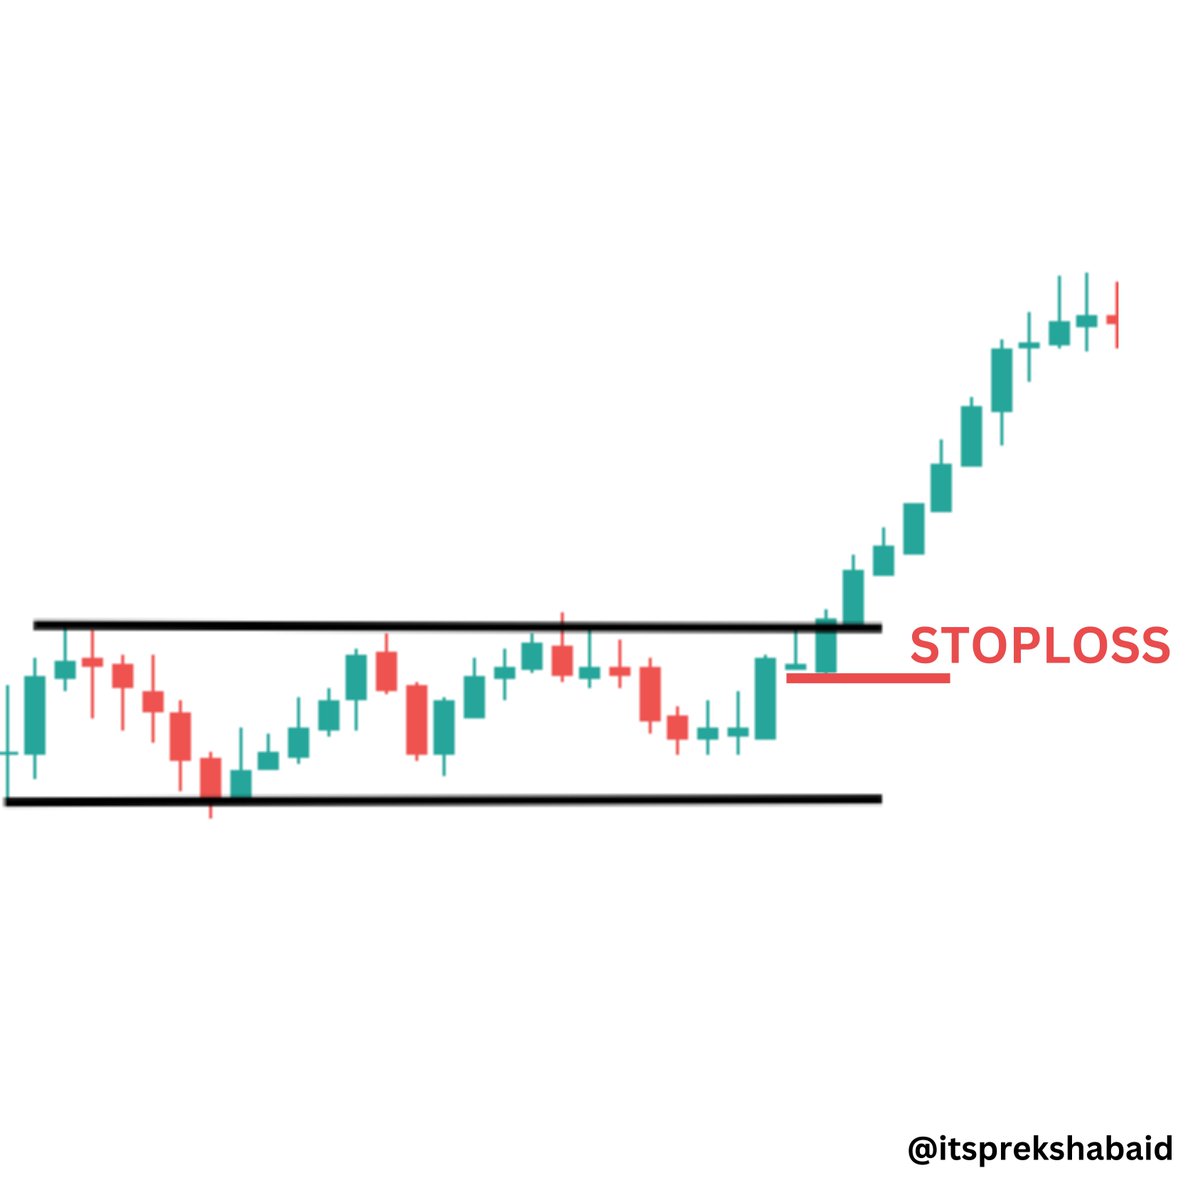
✅Here we saw a range bound move.
✅Took entry above the range breakout candle
✅Placed stoploss at the low of breakout candle
✅We saw a good rally in our favourable direction. (9/14)
#Banknifty 5 min chart : 13-Jan-2023
✅Here we saw a range bound move.
✅Took entry above the range breakout candle
✅Placed stoploss at the low of breakout candle
✅We saw a good rally in our favourable direction. (9/14)

#Banknifty 5 min chart : 06-Jan-2023
(When price breaks the range from downside)
✅Here we saw a range bound move.
✅Took entry below the range breakout candle
✅Placed stoploss at the high of breakout candle
✅We saw a good rally in our favourable direction. (10/14)
(When price breaks the range from downside)
✅Here we saw a range bound move.
✅Took entry below the range breakout candle
✅Placed stoploss at the high of breakout candle
✅We saw a good rally in our favourable direction. (10/14)

Banknifty 5 min chart : 29-Dec-2022
✅Here we saw a range bound move.
✅Took entry above the range breakout candle
✅Placed stoploss at the low of breakout candle
✅We saw a good rally in our favourable direction. (11/14)
✅Here we saw a range bound move.
✅Took entry above the range breakout candle
✅Placed stoploss at the low of breakout candle
✅We saw a good rally in our favourable direction. (11/14)

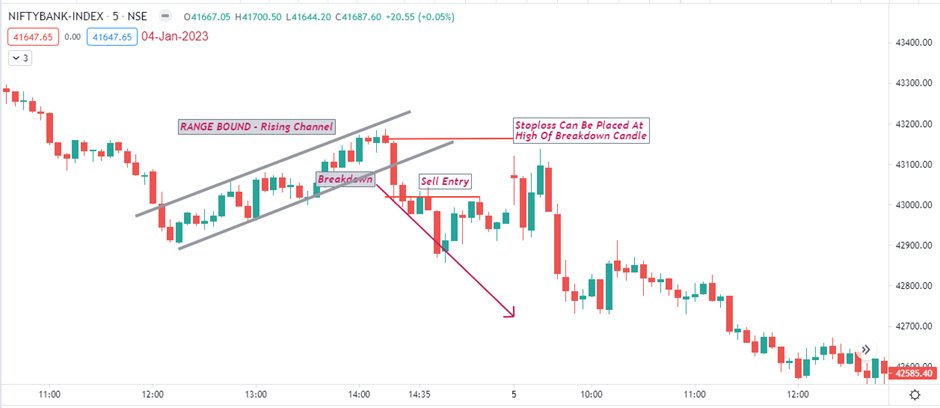
Banknifty 5 min chart : 04-Jan-2023
This is an example of Rising Channel.
✅Price was consolidating in a rising channel & once the price break this range, we can see the move in our favourable direction. (12/14)
This is an example of Rising Channel.
✅Price was consolidating in a rising channel & once the price break this range, we can see the move in our favourable direction. (12/14)
🌟Range breakout trading is very basic but powerful setup.
🌟My aim of this thread is to show all novice traders that even basic learning can be rewardable, & without any use of indicators we can catch good move in live market with our basic learnings. (13/14)
🌟My aim of this thread is to show all novice traders that even basic learning can be rewardable, & without any use of indicators we can catch good move in live market with our basic learnings. (13/14)
♥If you found this thread useful, please RT the first tweet.🔁 (14/14)
A thread: To learn BULLISH ENGULFING candlestick pattern. 👇
https://twitter.com/itsprekshaBaid/status/1611971054347644929
A thread: To learn Hammer candlestick pattern. 👇
https://twitter.com/itsprekshaBaid/status/1613103854870200321
• • •
Missing some Tweet in this thread? You can try to
force a refresh

