Andy West, PhD Profile picture
Feb 3 5 tweets 3 min read
#SPX $SPY Breadth Ratio update 🧵:

This situation continues to get more intriguing. After the rally the last 2 days, I expected this signal to be resoundingly rejected

But the % of stocks > their 20 day MA relative to those above 200 MA has fallen below 1... 1/4
$QQQ #stocks Image
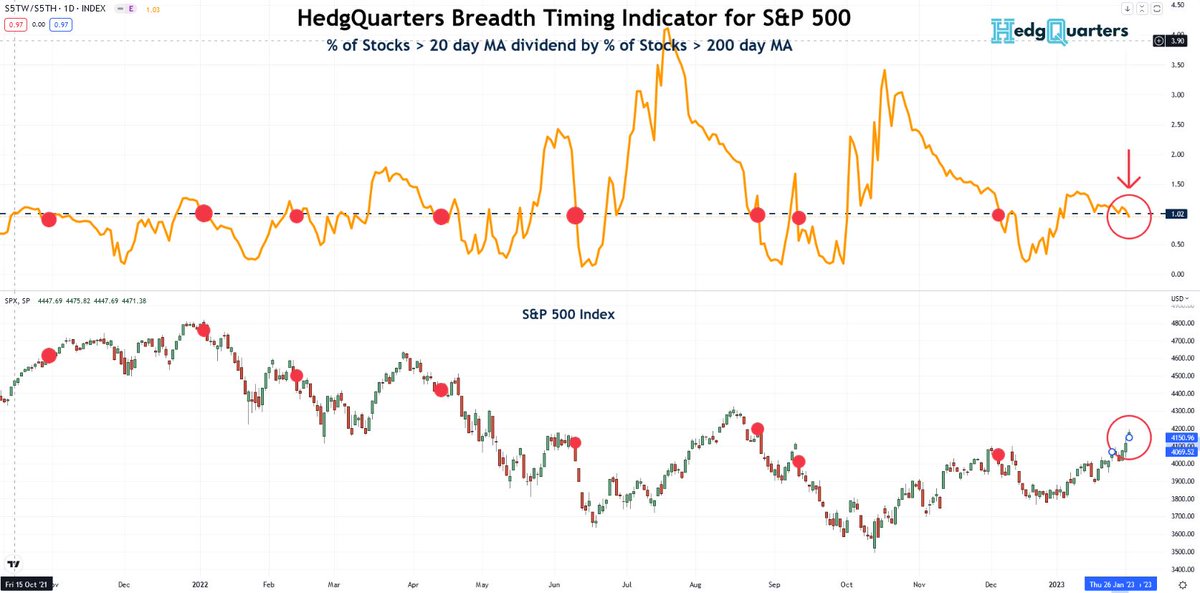
2/4 Whats this really showing?

Individual components of the ratio shown below

An increasing % of #stocks are above their 200 MA as expected in a rally, but the % above their 20 MA is flat potentially presaging declining momentum of the rally...

$SPY $QQQ #SPX Image
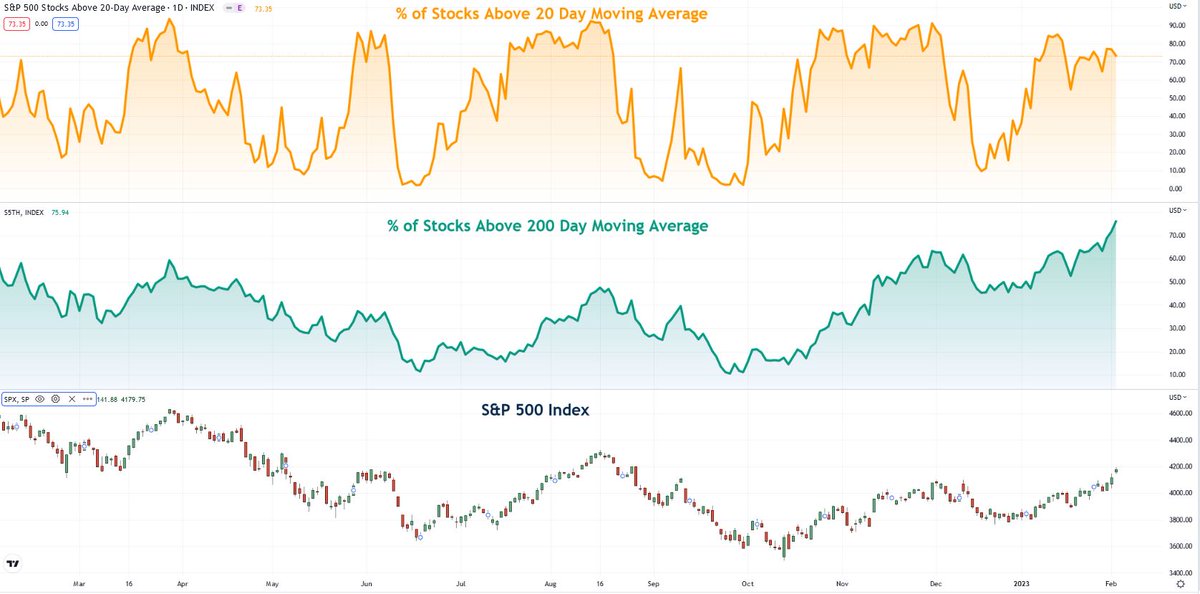
3/5 When the % > 200MA is very high like now, but the % > 20 day MA starts to weaken, then we typically conclude the rally is in late stage and at risk

This may not be yet - as seen in orange the % > 20DMA can fluctuate at highs for a while. But given some weakening 2day...
4/5 even as the market as a whole rallied, it bears close watching.

There is a LOT of ROTATION underneath the surface of this market that I will post separately. Materials stocks down, tech up (past winners dwn, losers up). Given size of tech generals, its carrying the market...
as a whole. Moving away from tech, the DJIA was flat showing another view of a different set of exposures.

Point being - this breadth ratio bears watching closely, as does rotational dynamics to look under the surface of the $SPY movements after such a strong January 5/5

• • •

Missing some Tweet in this thread? You can try to force a refresh
 

Keep Current with Andy West, PhD

Andy West, PhD Profile picture

Stay in touch and get notified when new unrolls are available from this author!

Read all threads

This Thread may be Removed Anytime!

PDF

Twitter may remove this content at anytime! Save it as PDF for later use!

Try unrolling a thread yourself!

how to unroll video
  1. Follow @ThreadReaderApp to mention us!

  2. From a Twitter thread mention us with a keyword "unroll"
@threadreaderapp unroll

Practice here first or read more on our help page!

More from @andycwest

Feb 5
WHATS HAPPENING WITH US EMPLOYMENT / PAYROLLS and implications
a thread:

1/x

After a +517k Jan 23 payrolls & resilient employment mth after mth despite a year of rate hikes, whats really happening & does it mean soft landing?

read on

#macro #unemployment #stocks $SPY $QQQ
2/x I'm not delving into statistical adjustments, this is about the real backdrop & whats driving overall trends. From that I'll draw some clarifying conclusions.

Here's the recent payrolls numbers charted. The trend shows payrolls normalizing down from elevated levels w/ chop Image
3/x Why were they elevated at the beginning of '22? Its all about the re-hiring of workers laid off during COVID. This is still on going.

The Chart shows US Total Employed. The US shed ~15% of its workforce as COVID hit and only recently surpassed 2019 levels, now +2% vs then. Image
Read 17 tweets
Dec 20, 2022
PREPARE FOR HIGHER VOLATILITY:

Important 🧵:

We’ve had a bear mkt rally which has now failed and partially unwound. Brief Santa rally or not, the following chart pack tells a clear story of impending volatility:

#macro #stocks $SPY $QQQ
Financial conditions:

This chart isn’t a mirror image - it’s the GS Fin Cond index against the #SPX. I’ve been tweeting updates on this for 6 mths because when conditions tighten, #stocks roll. Once again the Fed and now BoJ have triggered the tightening needed for inflation 🧯
Yields:

10 year yields are on the rise again with added fuel from the BoJ pivot yesterday. As the benchmark the risk free rate, this is negative for #SPX in the near term
Read 9 tweets
Dec 14, 2022
#Fed day: the down/up reaction of #stocks shows something here for both hawks & doves.

For me (looking ahead), the Fed faces a dilemma in 1H '23. Cool/negative goods/energy inflation but still strong wage gains given tight labor.

Headline CPI...
#macro
will fall (particularly in Q1), potentially to even ~5% by March data, but wage gains will see medium term services & core inflation drivers inconsistent in the Fed's lens with a sustainable return to 2-3% target.

So Mr Mkt is saying based on history, the Fed never keeps...
rates at peak for long (ie the market assumes rate cuts soon after the peak).

But we need to consider that perhaps this time, with the labor pool down due to COVID and structural labor tightness, the #Fed may be FORCED to keep rates at the peak plateau for longer...
Read 10 tweets
Nov 14, 2022
Updated Inflation, rates outlook & prospects for #bonds and #stocks:

We're moving into a new phase of disinflation from here. This is what I expect to see unfold: Update 🧵:

#macro $SPY $QQQ #inflation
Back in early August I wrote that we were about to experience a surge in core inflation into end Q3.

At the time #stocks had rallied strongly and this presaged another pullback given it meant the #Fed had to be more hawkish.

I was a touch early w/ mths:
This played out and I've posted my multi-factor inflation model for US CPI previously. It shows #inflation moderating quickly in mid 2023:

Fair to say this generates skepticism. The narrative is once CPI >5% it stays there for > 2 years. Well where to now? Image
Read 13 tweets
Oct 26, 2022
$GOOGL: I honestly don't even know where to start in breaking down this disaster of a quarter from $GOOG (and no, I'm NOT short, except by way of sector ETF).

Read the usual bulge bracket broker reports and you'd think this is ok. Its NOT and here's why

a 🧵:
$QQQ $SPY
First - is this rev growth a pass or fail? Simply - BIG fail. Here's the internet advertising price growth chart from HedgQuarter's Info Tech Sector Drivers dashboard

Ad prices are still up 10-20% YoY so the 10% rev growth for search ads & 3.8% for YouTube is abysmal.
2nd - are costs being managed? If you were the owner of a business whose mgt grew its headcount by 20% while in the last 2 Qtrs your net revs grew 12% & 7%, I think you'd have a few choice words.

$GOOG mgt bought their own B/S and chowed down. They thought it would last 4ever
Read 6 tweets
Oct 19, 2022
PART 2 of 2 - Bond crash implications for stocks:

Why does the #bonds crash signal further pressure for #stocks?
(& why do rate hikes take so long to show in earnings?)

Here I deal with general corporates, consumer & the banks:
$SPY $QQQ #macro
CORPORATES:

As cost of capital rises, the direct impact on corporate earnings starts small then builds. The direct impact of higher rates on corporate borrowings can be estimated to be only approx -2-3% on EPS extra each year due to termed out debt at past low rates. But
about 20% of debt gets refi’d each yr so this builds to a more material headwind over 12-24 mths.

WORKING CAPITAL EFFECTS

Working capital terms start to get tightened by companies as rates rise. Due to WC debt costs (mainly floating rates), companies are forced to offer
Read 21 tweets

Did Thread Reader help you today?

Support us! We are indie developers!


This site is made by just two indie developers on a laptop doing marketing, support and development! Read more about the story.

Become a Premium Member ($3/month or $30/year) and get exclusive features!

Become Premium

Don't want to be a Premium member but still want to support us?

Make a small donation by buying us coffee ($5) or help with server cost ($10)

Donate via Paypal

Or Donate anonymously using crypto!

Ethereum

0xfe58350B80634f60Fa6Dc149a72b4DFbc17D341E copy

Bitcoin

3ATGMxNzCUFzxpMCHL5sWSt4DVtS8UqXpi copy

Thank you for your support!

Follow Us on Twitter!

:(