WHATS HAPPENING WITH US EMPLOYMENT / PAYROLLS and implications
a thread:
1/x
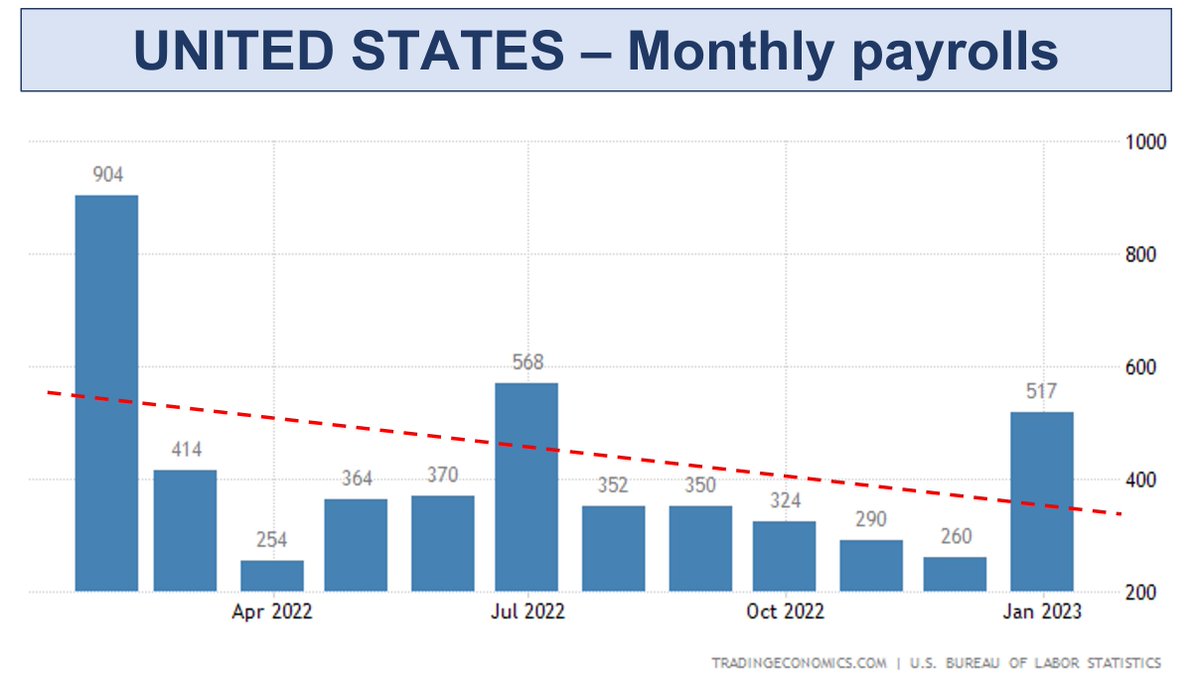
After a +517k Jan 23 payrolls & resilient employment mth after mth despite a year of rate hikes, whats really happening & does it mean soft landing?
read on
#macro #unemployment #stocks $SPY $QQQ
a thread:
1/x
After a +517k Jan 23 payrolls & resilient employment mth after mth despite a year of rate hikes, whats really happening & does it mean soft landing?
read on
#macro #unemployment #stocks $SPY $QQQ
2/x I'm not delving into statistical adjustments, this is about the real backdrop & whats driving overall trends. From that I'll draw some clarifying conclusions.
Here's the recent payrolls numbers charted. The trend shows payrolls normalizing down from elevated levels w/ chop
Here's the recent payrolls numbers charted. The trend shows payrolls normalizing down from elevated levels w/ chop
3/x Why were they elevated at the beginning of '22? Its all about the re-hiring of workers laid off during COVID. This is still on going.
The Chart shows US Total Employed. The US shed ~15% of its workforce as COVID hit and only recently surpassed 2019 levels, now +2% vs then.
The Chart shows US Total Employed. The US shed ~15% of its workforce as COVID hit and only recently surpassed 2019 levels, now +2% vs then.
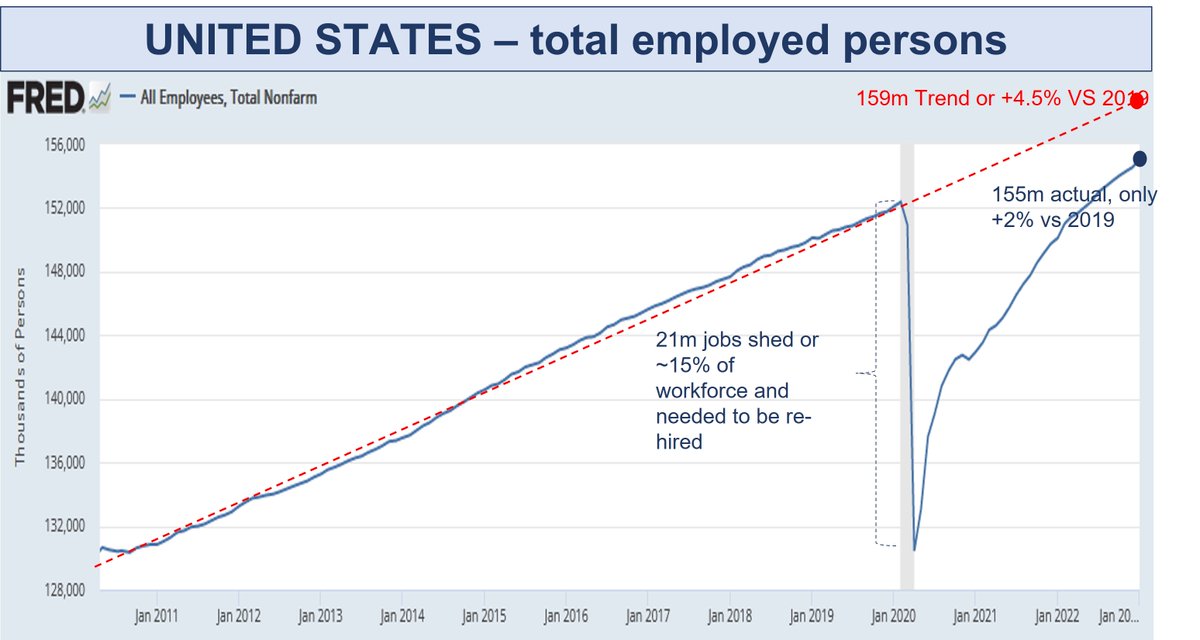
4/x Has re-hiring finished? NO and thats what is continually surprising the economists payrolls forecasts.
Trend can be looked at many ways. Simplistically, the past employment trend could put normal employment at 159m, +4m workers higher than now
Trend can be looked at many ways. Simplistically, the past employment trend could put normal employment at 159m, +4m workers higher than now

5/x If we look at it in GDP terms, then we can see a similar dynamic
This chart shows real GDP per employed person & highlights that its still elevated above long term trends following the COVID handouts, fiscal spend and monetary looseness
Companies are still running...
This chart shows real GDP per employed person & highlights that its still elevated above long term trends following the COVID handouts, fiscal spend and monetary looseness
Companies are still running...

6/x
...understaffed relative to their output/sales but with GDP/employed normalizing down since 2021, its likely this needs to decline more before businesses feel real pressure (due to margins/earnings) to fire workers.
Which industries are still in hiring mode?
...understaffed relative to their output/sales but with GDP/employed normalizing down since 2021, its likely this needs to decline more before businesses feel real pressure (due to margins/earnings) to fire workers.
Which industries are still in hiring mode?
7/x Government, Retail and Leisure/hospitality are the 3 areas still well under 2019 employment levels. Leisure was the big one driving ~30% of Jan's payrolls gain. Retail is not really net hiring again but govt is slowly.

8/x How does this compare to international employment trends?
Countries like Australia took a different approach to employment over COVID with job protection schemes that reduced layoffs and hastened rehiring.
Here's where Australia is now as an example reinforcing that the...
Countries like Australia took a different approach to employment over COVID with job protection schemes that reduced layoffs and hastened rehiring.
Here's where Australia is now as an example reinforcing that the...

9/x US has more re-hiring to go. Australian total employment is +6% vs 2019 pre COVID levels vs the US at +2%
This is because Australia only shed 7% of its workforce & as "Jobkeeper" was instigated quickly, rehired those workers before they could move, emigrate, retire etc.
This is because Australia only shed 7% of its workforce & as "Jobkeeper" was instigated quickly, rehired those workers before they could move, emigrate, retire etc.

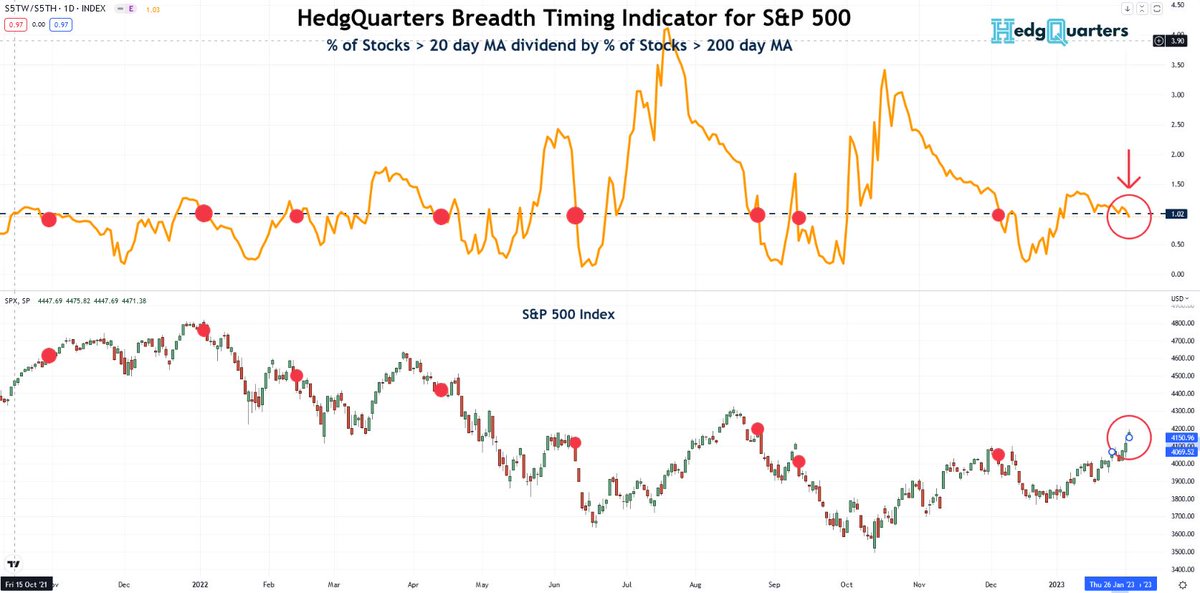
10/x Back to the US however and despite the rehiring trend post COVID still ongoing, we do still see evidence of the expected economic cycle playing out:
Contraction in the NAHB Home index, ISM manufacturing, ISM services and yield curve inversion
I always like this chart...
Contraction in the NAHB Home index, ISM manufacturing, ISM services and yield curve inversion
I always like this chart...

11/x which shows the cyclical forces at play that would be expected in a rate hike cycle. Rates, up, home building tails off followed by cyclical industry unemployment.
In this cycle, we simply need to understand that the COVID rehiring dynamic is at play delaying the impact...
In this cycle, we simply need to understand that the COVID rehiring dynamic is at play delaying the impact...
12/x of the rate cycle on employment statistics.
When we see the intersection of the rehiring dynamic having played out, coupled with full lagged impacts of the rate hikes, then I'd expect "normal" recessionary trends to start to be seen...
When we see the intersection of the rehiring dynamic having played out, coupled with full lagged impacts of the rate hikes, then I'd expect "normal" recessionary trends to start to be seen...
13/x Unemployment rises, spending & GDP falls, the Fed cuts rates, corporate earnings fall, stocks fall.
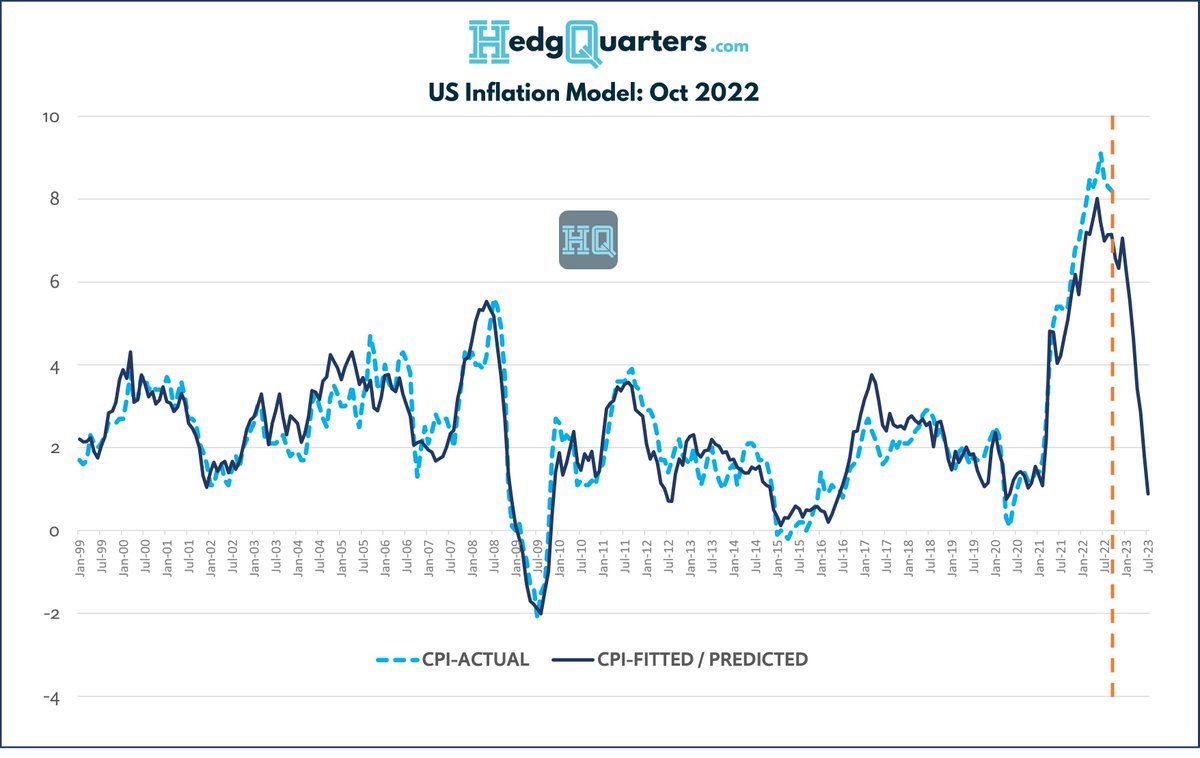
The hardest part is knowing when that will be. Inflation is still supporting nominal earnings but it is receding.
Recent high freq data suggests the CPI glide path down...
The hardest part is knowing when that will be. Inflation is still supporting nominal earnings but it is receding.
Recent high freq data suggests the CPI glide path down...
14/x may be about to slow. We may see YoY CPI for Jan in line with December & only a small decline in Feb data given food and fuel prices rising.
CPI declines will likely be greater in Mar & April data as that cycles the worst from the prior year. But...
CPI declines will likely be greater in Mar & April data as that cycles the worst from the prior year. But...
https://twitter.com/andycwest/status/1622005843729448960?s=20&t=qjC02IcTnGozEOsjWJQEsA
15/x we need to watch oil prices and any China consumption effects on commodities closely for threats of a new inflation wave that results in more rate hikes.
Meanwhile, it may take 9+ mths for that COVID rehiring of another 3-4m jobs to play out behind the scenes
So...
Meanwhile, it may take 9+ mths for that COVID rehiring of another 3-4m jobs to play out behind the scenes
So...
16/x
DON't be surprised if the term "soft-landing" remains around for a while before the rug being pulled in Q3 or Q4 this year.
If this is useful insight, consider pre-registering for the HedgQuarters.com platform launch this year.
Macro to micro connecting the dots
DON't be surprised if the term "soft-landing" remains around for a while before the rug being pulled in Q3 or Q4 this year.
If this is useful insight, consider pre-registering for the HedgQuarters.com platform launch this year.
Macro to micro connecting the dots
17/17 As a P.S., if you're wondering where all this labor can come from with unemployment at decade lows, it has to be from the participation rate normalizing upwards.
Pre COVID it was 63.3%, before the GFC 66%. Today 62.4%.
As savings disappear, people come out of retirement.
Pre COVID it was 63.3%, before the GFC 66%. Today 62.4%.
As savings disappear, people come out of retirement.

• • •
Missing some Tweet in this thread? You can try to
force a refresh