#COVID19 Monthly mortality rates, by age, per 100,000 population, England. 2022
Age 18-39
The #Unvaccinated have a lower mortality rate, than any of the vaccinated groups 📉
The data the ONS did not want you to see⬇️
Other age groups in thread 🧵
1/6
Source: #ONS #UKHSA 🇬🇧
Age 18-39
The #Unvaccinated have a lower mortality rate, than any of the vaccinated groups 📉
The data the ONS did not want you to see⬇️
Other age groups in thread 🧵
1/6
Source: #ONS #UKHSA 🇬🇧

#COVID19 Monthly mortality rates, by age, per 100,000 population, England. 2022
Age 40-49
The #Unvaccinated have a lower mortality rate, than any of the vaccinated groups, over the duration of 2022
🔵 Unvaccinated
🟠 1 dose
🔘 2 dose
🔴 Booster dose
📈 Ever vaccinated
2/6
Age 40-49
The #Unvaccinated have a lower mortality rate, than any of the vaccinated groups, over the duration of 2022
🔵 Unvaccinated
🟠 1 dose
🔘 2 dose
🔴 Booster dose
📈 Ever vaccinated
2/6

#COVID19 Monthly mortality rates, by age, per 100,000 population, England. 2022
Age 50-59
The #Unvaccinated have a lower mortality rate, than Dose 1 & Dose 2 vaccinated
Booster dose showing marginal benefit📈📉
🔵 Unvaccinated
🟠 1 dose
🔘 2 dose
🔴 Booster dose
3/6
Age 50-59
The #Unvaccinated have a lower mortality rate, than Dose 1 & Dose 2 vaccinated
Booster dose showing marginal benefit📈📉
🔵 Unvaccinated
🟠 1 dose
🔘 2 dose
🔴 Booster dose
3/6

#COVID19 Monthly mortality rates, by age, per 100,000 population, England. 2022
Age 60-69
The #Unvaccinated clearly have a lower mortality rate than any of the vaccinated groups 📉
🔵 Unvaccinated
🟠 1 dose
🔘 2 dose
🔴 Booster dose
📈 Ever vaccinated
4/6
Age 60-69
The #Unvaccinated clearly have a lower mortality rate than any of the vaccinated groups 📉
🔵 Unvaccinated
🟠 1 dose
🔘 2 dose
🔴 Booster dose
📈 Ever vaccinated
4/6

#COVID19 Monthly mortality rates, by age, per 100,000 population, England. 2022
Age 70-79
The #Unvaccinated have a lower mortality rate, than Dose 1 & Dose 2 vaccinated
Also lower rate than #Booster since June 2022
🔵 Unvaccinated
🟠 1 dose
🔘 2 dose
🔴 Booster dose
5/6
Age 70-79
The #Unvaccinated have a lower mortality rate, than Dose 1 & Dose 2 vaccinated
Also lower rate than #Booster since June 2022
🔵 Unvaccinated
🟠 1 dose
🔘 2 dose
🔴 Booster dose
5/6

#COVID19 Monthly mortality rates, by age, per 100,000 population, England. 2022
Age 80+
The #Unvaccinated have a lower mortality rate, than Dose 1 & Dose 2 vaccinated
Rate closely matches #Booster for last 6 months
🔵 Unvaccinated
🟠 1 dose
🔘 2 dose
🔴 Booster dose
End
Age 80+
The #Unvaccinated have a lower mortality rate, than Dose 1 & Dose 2 vaccinated
Rate closely matches #Booster for last 6 months
🔵 Unvaccinated
🟠 1 dose
🔘 2 dose
🔴 Booster dose
End

Population figures from each vaccination group
Data extracted from U.K. Health Security Agency data
Population figures used throughout 2022 are based on the mid-year figure
Only adult (18+) population figures have been included, for both vaccinated and unvaccinated
Data extracted from U.K. Health Security Agency data
Population figures used throughout 2022 are based on the mid-year figure
Only adult (18+) population figures have been included, for both vaccinated and unvaccinated

Vaccination rates per age group are also taken from the U.K. Health Security Agency
Vaccine uptake % each month are based on the mid-month published figures
Not perfect. but certainly far more accurate than the ONS figures- based on incomplete census
gov.uk/government/sta…
Vaccine uptake % each month are based on the mid-month published figures
Not perfect. but certainly far more accurate than the ONS figures- based on incomplete census
gov.uk/government/sta…
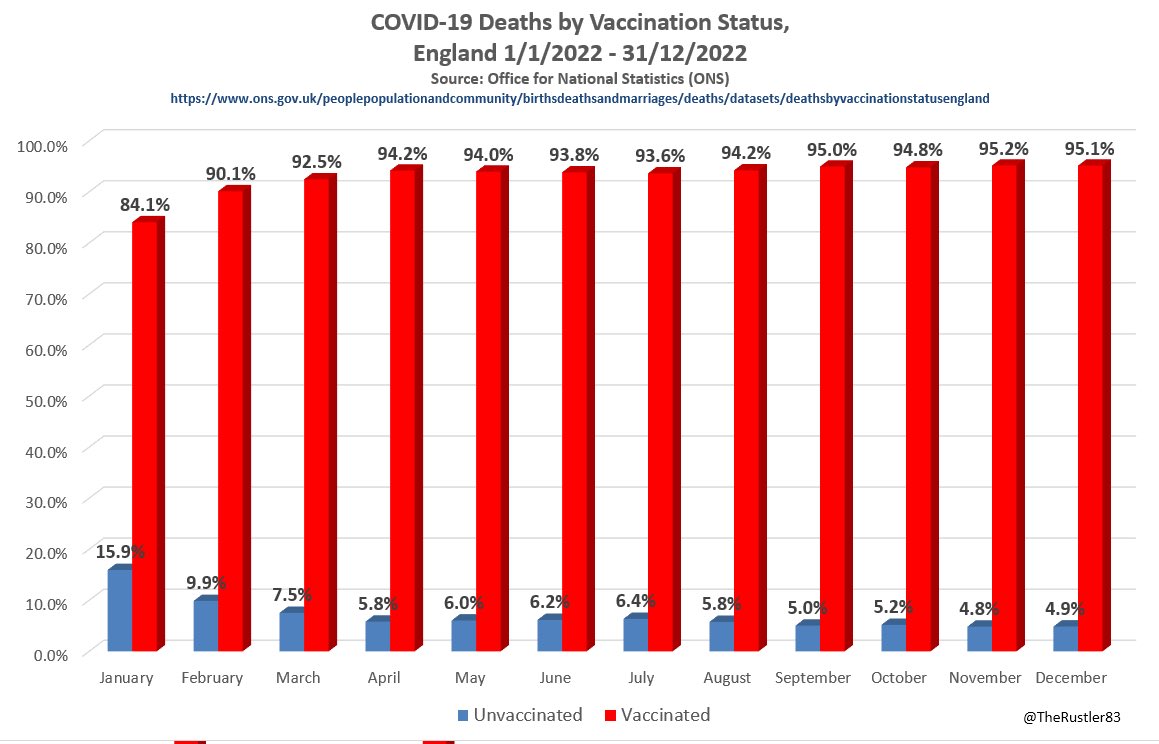
#COVID mortality data extracted from the infamous #ONS ‘Death by vaccination status’ dataset (Table 1)
The ONS really need to add 5 year age gaps (rather than 10) to make for better comparisons
Having 80+ & 18-39 ranges is also pretty poor ONS
ons.gov.uk/peoplepopulati…
The ONS really need to add 5 year age gaps (rather than 10) to make for better comparisons
Having 80+ & 18-39 ranges is also pretty poor ONS
ons.gov.uk/peoplepopulati…

Age categorised, population adjusted mortality data …. the stuff of dreams after negotiating that nightmare ONS dataset this week ….
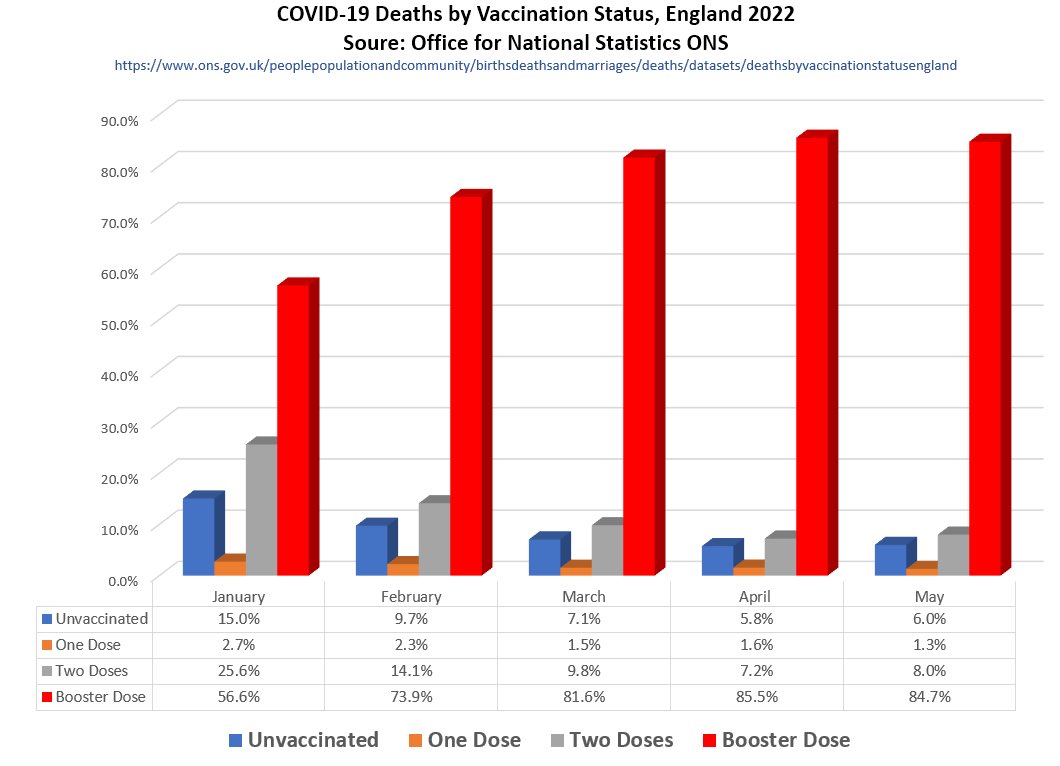
The data is clear
No measurable benefit
Unvaccinated performing best across almost all age groups 💪💪🔥🔥🔥🔥 ⬇️ remember this claim🔥🔥
The data is clear
No measurable benefit
Unvaccinated performing best across almost all age groups 💪💪🔥🔥🔥🔥 ⬇️ remember this claim🔥🔥

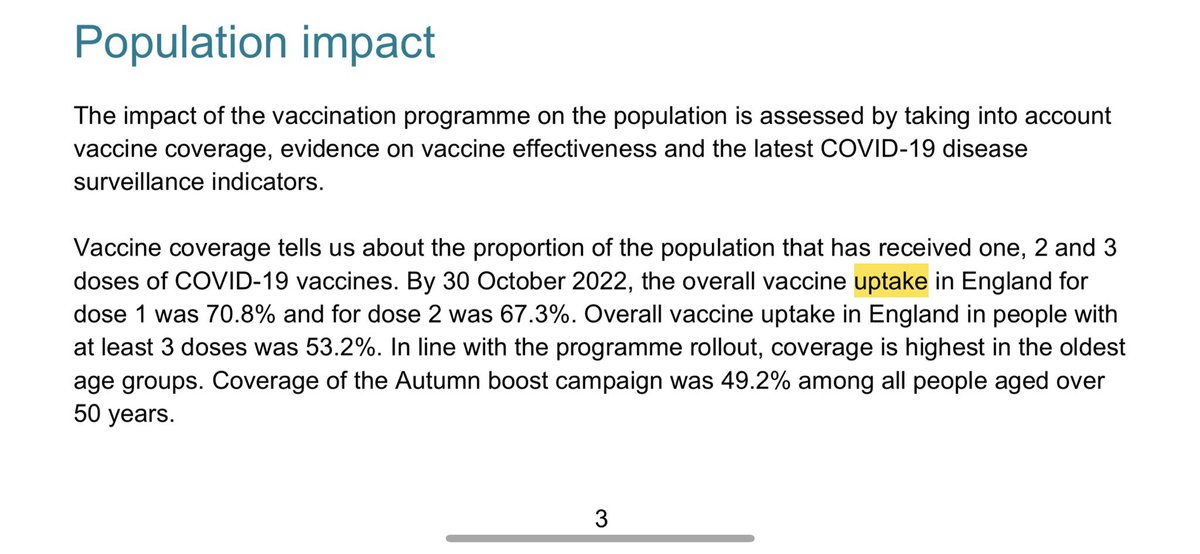
‘By 12 June 2022, the overall vaccine uptake in England for dose 1 was 70.2% and for dose 2 was 65.9%..
These vaccination uptake figures are for the entire population of England 🏴
As published by the UK Health & Security Agency- with access to NHS data
gov.uk/government/pub…
These vaccination uptake figures are for the entire population of England 🏴
As published by the UK Health & Security Agency- with access to NHS data
gov.uk/government/pub…

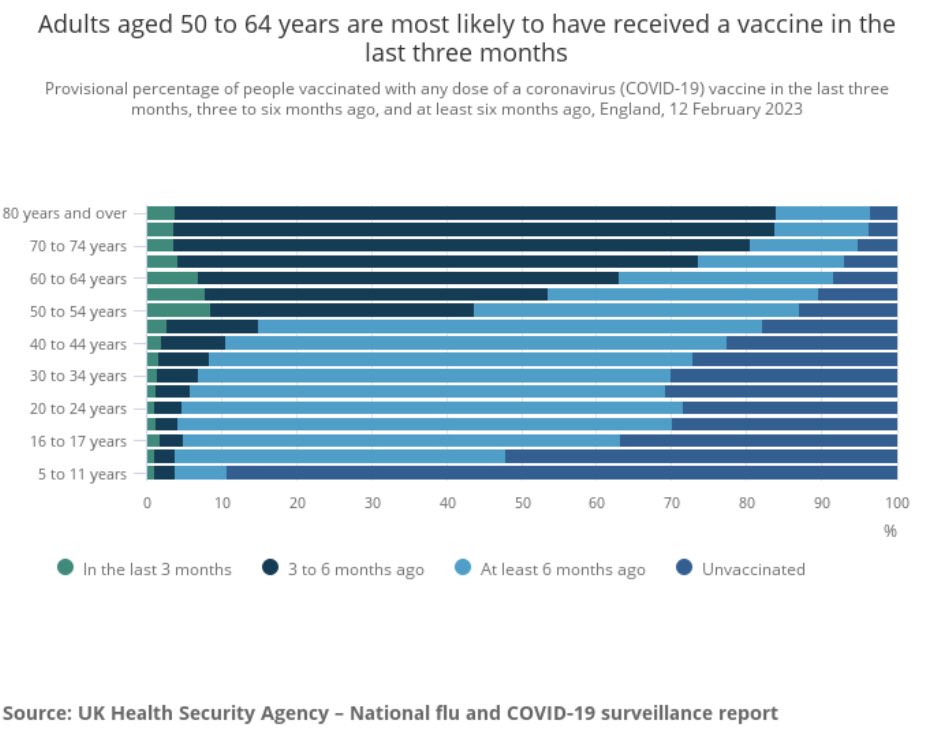
‘The vaccine uptake rate in adults aged 18 and over was 81.6% for dose 1; 78.7% for dose 2 and 64.3% for dose 3’
Critical difference between HSA & ONS vax% is that HSA has access to actual NHS records
ONS %s are an ‘estimate, - and it looks way low …
gov.uk/government/sta…
Critical difference between HSA & ONS vax% is that HSA has access to actual NHS records
ONS %s are an ‘estimate, - and it looks way low …
gov.uk/government/sta…

• • •
Missing some Tweet in this thread? You can try to
force a refresh