1/ #Nvidia is world’s eighth largest companies in terms of Market Cap (~$582 bn).
It is not as large in terms of revenue ($27 bn, FY23 Jan YE), but perhaps its business and its opportunities make the market value this high. Perhaps. Difficult to fathom.
A thread.
It is not as large in terms of revenue ($27 bn, FY23 Jan YE), but perhaps its business and its opportunities make the market value this high. Perhaps. Difficult to fathom.
A thread.
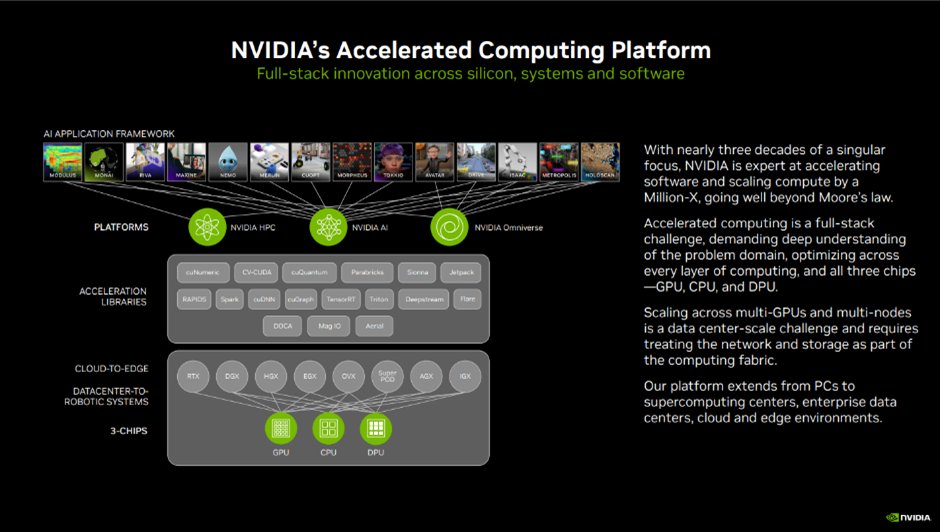
2/ Set up in 1993, Nvidia makes chips, software and systems. Or platforms.
It was set up in 1993.
In 1999, it invented the #GPU which forms its core business even today.
From early focus on PC Graphics, they have expanded to several computationally intensive fields.
It was set up in 1993.
In 1999, it invented the #GPU which forms its core business even today.
From early focus on PC Graphics, they have expanded to several computationally intensive fields.
3/ What is a GPU?
GPU is Graphics Processing Unit. Initially launched for graphics, it has now evolved into an important computational tech.
In 2006, Nvidia introduced CUDA programming model which opened parallel processing capabilities of GPU for general purpose computing.

GPU is Graphics Processing Unit. Initially launched for graphics, it has now evolved into an important computational tech.
In 2006, Nvidia introduced CUDA programming model which opened parallel processing capabilities of GPU for general purpose computing.


4/ GPUs are used by Gamers, Researchers & Developers, Cloud Service Providers, Consumer Internet companies, and automation needs across a range of industries.
Some of the most recent applications of GPU: recommendation systems, large language models, generative AI.
Some of the most recent applications of GPU: recommendation systems, large language models, generative AI.
5/ “Nvidia now serves over three million developers and is available from every major computer maker and cloud, and has been adopted by over 25,000 companies in 100 trillion dollars' worth of industries.” 

7/ Nvidia earns revenue through
a) Sale of Product (key source)
b) license and Development Arrangements with customers which require customisation
c) Software licensing and
d) Cloud Services which allows usage of S/W and H/W without buying either.

a) Sale of Product (key source)
b) license and Development Arrangements with customers which require customisation
c) Software licensing and
d) Cloud Services which allows usage of S/W and H/W without buying either.


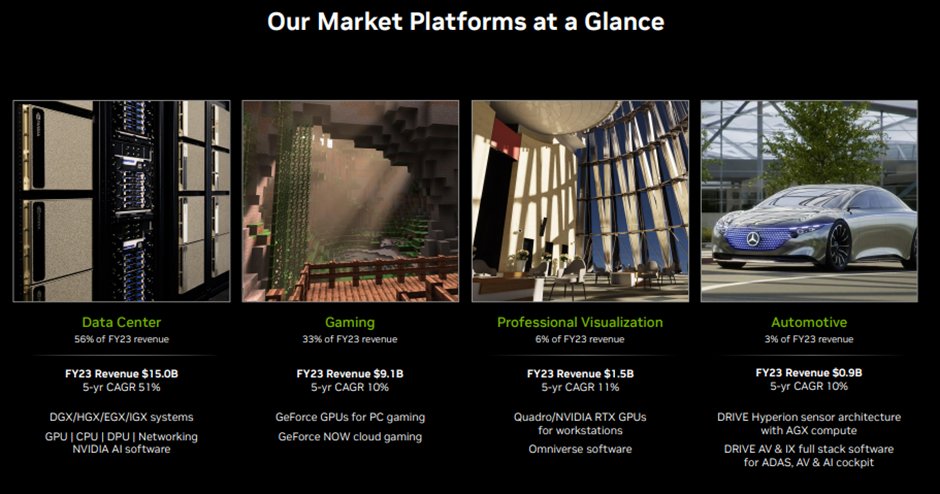
8/ #Nvidia's business is organised around the key markets it caters to- Data Centres, Gaming, Professional Visualisation and Automotive.
The Data Centres platform is currently the largest business for Nvidia ($15 billion revenue). Here’s a look at revenue over the years.


The Data Centres platform is currently the largest business for Nvidia ($15 billion revenue). Here’s a look at revenue over the years.


9/ Although for reporting, it segments its revenue across 'Compute & Networking' segment and 'Graphics Segment'.
Here is some info on reported segments - Compute & Networking is $15 billion business, while Graphics is $12 billion.

Here is some info on reported segments - Compute & Networking is $15 billion business, while Graphics is $12 billion.


10/ There seem to be two kinds of GPU markets – Integrated and Discrete.
Nvidia is the market leader in discrete GPU (78% share Q122), while Intel ($63b revenue) is the leading supplier for Integrated/ PC GPUs.
Other players include AMD ($23.6b revenue), Google, IBM, Qualcomm
Nvidia is the market leader in discrete GPU (78% share Q122), while Intel ($63b revenue) is the leading supplier for Integrated/ PC GPUs.
Other players include AMD ($23.6b revenue), Google, IBM, Qualcomm

11/ Here is Nvidia's historical revenue snapshot.
For context, its 2002 revenue was $1.37 billion.
It closed FY 2019 (Jan YE) at $11.7 billion, FY 2022 at $26.9 billion and FY23 at $27 billion.

For context, its 2002 revenue was $1.37 billion.
It closed FY 2019 (Jan YE) at $11.7 billion, FY 2022 at $26.9 billion and FY23 at $27 billion.


12/ To further grasp the business strategy, product and operations, here is a year-old shareholder letter explaining the approach to product and markets 

13/ The company employs ~26k people across 35 countries, with 19.5k employees engaged in R&D.
Nvidia has invested $37 billion in R&D since inception.
Nvidia has invested $37 billion in R&D since inception.
14/ Despite all the opportunity in the sector, on first look it is difficult to fathom the high valuation. The company closed FY23 at similar sales as FY22, with lower operating margins and much higher inventory levels.
Here is income statement, balance sheet and cash flow stmt


Here is income statement, balance sheet and cash flow stmt


15/ For further historical perspective, here is the market cap history chart for the company.
The company repurchased some of its shares in FY23.
The company repurchased some of its shares in FY23.

16/ Per Balance Sheet, total shareholder equity is $22 bn, a small fraction of the market cap of ~$582 bn.
The company has plenty opportunities. Still.
To further explore:
-gross margin across different consumer sets and the impact of changing revenue profile.
-Inventory
The company has plenty opportunities. Still.
To further explore:
-gross margin across different consumer sets and the impact of changing revenue profile.
-Inventory
17/ Here is an article which explains some of the excitement around the company, its market and valuation. (tinyurl.com/474r9w5f)
Still, at some level the company valuation seems to be dissonant from its current scale of operations.
Still, at some level the company valuation seems to be dissonant from its current scale of operations.
• • •
Missing some Tweet in this thread? You can try to
force a refresh


