Ted Darling Profile picture
Mar 12, 2023 16 tweets 9 min read Read on X
🐻♉️↗️↘️↔️⚠️🚩🔺🔻💰
Macro Review 03/10/23

🧵 1/8

The #Kraken may have been unleashed on financial markets this week with volatility up across asset classes.

Let’s dig into the critical 🧮 from the week!
© Adobe Stock
2a/8

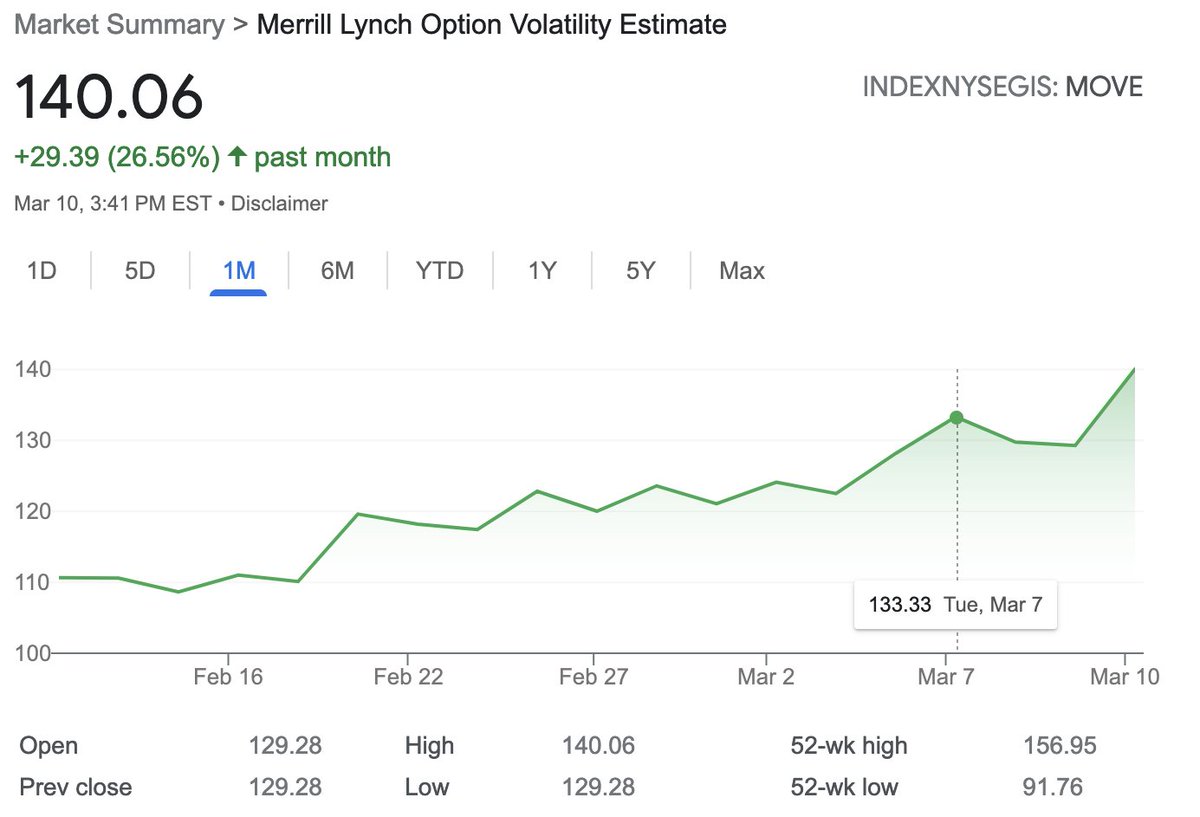
After a week of reflation and my #CrashRiskRising call from 02/26/23, Jay Powell stepped up to the plate and told us “dot plot going higher.”

The UST2Y ripped, the curve inverted further, and the MOVE ↗️

Chart: MOVE index 140.06
2b/8

After two days of Powell chatting with Congress, the UST 2Y accelerated to 5.05%, a multi-year high, before crashing hard on the SVB news.

Chart: $UST2Y with -1.6 STD move in 2 days
2c/8

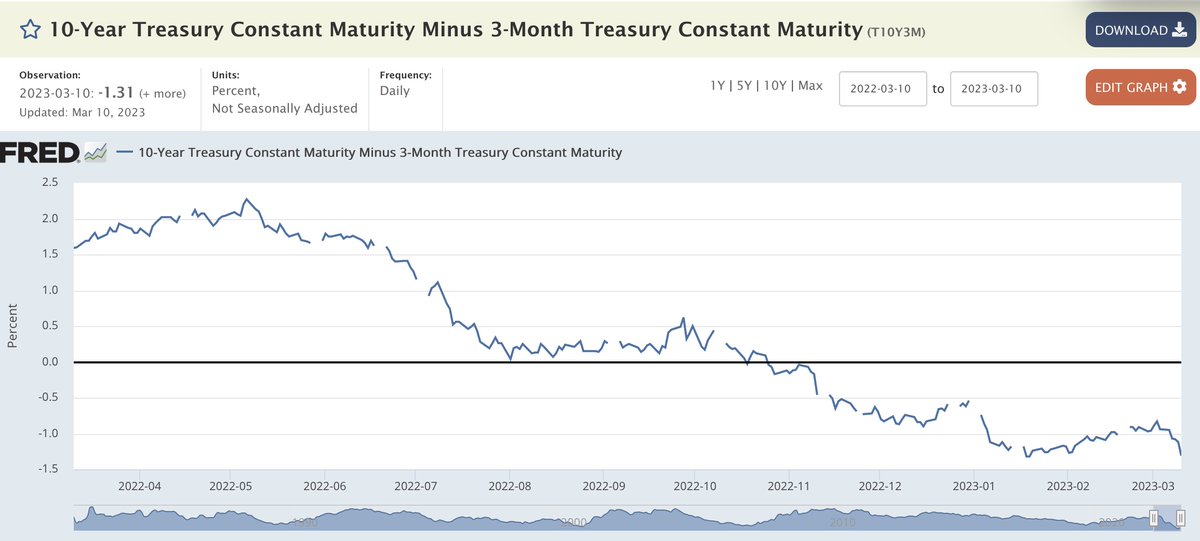
By the end of the week, the 10Y3M curve re-inverted to a a cycle low of -131 bps

“It’s nothing, bro.” It’s priced in. You can't make money with a consensus view by buying bonds because you think a recession is coming.

Yup, this time is different. ✅

Chart: 10Y3M
2d/8

By the end of the week, long bonds were ripping on the SVB news.

You see - the freaking MOVE and the inverted yield curve were telling you something. #Kraken

Chart: TLT daily +3.46% in a single day
3a/8

And then we have equities.

Mike Wilson, the highly respected MS CIO who had maintained a consistently bearish outlook, capitulated on Monday, March 6

3b/8

The $VIX hit a low of 18.14 the same day Mike capitulated; it steadied, rose on Powell, and ripped on SVB

Chart: $VIX daily closed at 24.80 after tagging 28.97 intraday on Friday. #Kraken
3c/8

More concerning, the vol of vol 🚀🚀

Chart: $VVIX crossing the read line on the weekly #Kraken
3d/8

The $SPX put in a big higher low at 4078 the very day Mike capitulated, before 🤮

Chart: $SPX daily shed -4.7% in 4 days #Kraken
3e/8

Small caps starting selling on Monday and never looked back

Chart: $IWM daily -8.0% on the week #Kraken
4/8

#NFP came out relatively hot on Friday +311,000 with wages +4.6% y/y, but it didn’t matter as it was quickly subsumed by SVB, the 15th largest bank in the US, imploded to FDIC receivership

Chart: US Average Hourly Earnings #AHE ticked up to +4.6%
5/8

On any other day, the $USD would have ripped higher as +50 BPS became fully priced into the 3/22 #FOMC meeting. But SVB called that all into question as the Fed may be forced to ease rather than tighten to avoid a banking #Kraken
6/8

GOLD, on the other hand, benefited from the drop in yields and the USD as well as the underlying concern about more bank runs.

Chart: $GOLD, after putting in a short-term double bottom at 1813, climbed +2.7% in 2 days
Kryptonite for the #Kraken
7a/8

Was it Powell? Was it SVB?

Doesn’t matter - our concern could quickly shift from sticky #inflation to outright deflation if more banks are forced to realize losses by selling their “pristine” reserves, notably USTs and MBS. #Kraken
7b/8

Banks have been complacent for too long with free deposits.

Investors have discovered money markets yielding 4.5% and T-bills at 5%

Depositors pull deposits, and banks are forced to realize losses on collateral, setting up a self-reinforcing downward spiral #Kraken
8/8

Crash risk is no longer rising.

It is right in front of us.

Next week will be telling and complex with a HUGE March #OPEX on Friday, Uncle Carl ITM, and big risks to the down side

Avoid the #Kraken and have a super profitable 💰 week!

• • •

Missing some Tweet in this thread? You can try to force a refresh
 

Keep Current with Ted Darling

Ted Darling Profile picture

Stay in touch and get notified when new unrolls are available from this author!

Read all threads

This Thread may be Removed Anytime!

PDF

Twitter may remove this content at anytime! Save it as PDF for later use!

Try unrolling a thread yourself!

how to unroll video
  1. Follow @ThreadReaderApp to mention us!

  2. From a Twitter thread mention us with a keyword "unroll"
@threadreaderapp unroll

Practice here first or read more on our help page!

More from @tdarling1

Sep 22
Summary of FOMC Press Conference (09/18/24):

Jay Powell announced a 50 basis point (bps) cut to the federal funds rate, citing the need for "recalibration" of monetary policy as the economy continues to moderate. The labor market has cooled, with job growth slowing, and inflation remains slightly above target. Powell emphasized that policy adjustments are not on a "pre-set course" and will be made on a meeting-by-meeting basis to support the Fed’s dual mandate of full employment and stable prices. The Fed projects a federal funds rate of 4.4% by year-end, moving towards 3.4% by the end of 2025.

Key Points and Implications:

Rate Cut Justification: The Fed's decision to cut rates by 50 bps reflects a proactive stance in ensuring economic stability, acknowledging moderating growth and softening inflation pressures.

Economic Growth and Labor Market: While growth is forecast at 2.2%, the labor market has softened, with average monthly job gains of 116,000 over the past three months. This cooling labor market suggests the risk of inflation from wage growth has decreased.

Inflation Outlook: Despite inflation remaining above 2%, with core inflation at 2.7%, Powell believes inflation expectations are well anchored and sees the current policy stance as effective in bringing inflation down toward the target.

Future Interest Rate Trajectory: The Fed projects a median federal funds rate of 4.4% by the end of 2024 and 3.4% by the end of 2025. Powell stressed flexibility, indicating future rate cuts will be data-dependent.

Balance Sheet Policy: The balance sheet runoff will continue, with reserves expected to remain stable and abundant. There is no immediate plan to halt the reduction, which could signal tighter liquidity conditions.

Risks to the Economy: Powell highlighted that while the economy remains solid, risks have increased. The Fed is attentive to both its employment and inflation mandates and is prepared to adjust policy as needed.

No Pre-set Course: Powell emphasized that the Fed is not committed to further cuts or hikes at each meeting. They will take a "meeting-by-meeting" approach, carefully assessing economic data.

Housing Sector: Powell noted that housing remains weak, with market rents growing at a slower pace. Housing is expected to normalize as rates stabilize.

Implications for the Economy and Interest Rates:

Short-Term: The rate cut is expected to provide some support to the economy, preventing a sharper slowdown. However, the Fed remains cautious, particularly about the labor market and inflationary pressures.

Long-Term Interest Rate Outlook: The Fed's median projection of a federal funds rate at 3.4% by the end of 2025 suggests a more accommodative stance over time, though the neutral rate could be higher than previously thought.

Labor Market Impact: If labor market weakness continues, the Fed could make additional cuts to support employment, though Powell made it clear they are not currently seeing signs of rising layoffs.

Inflation Risks: With inflation still above the 2% target, the Fed will remain vigilant. The recalibration strategy is aimed at avoiding both excessive inflation and economic contraction.

Potential for Additional Cuts: If the economy weakens or inflation falls faster than expected, further rate cuts are possible, but Powell indicated the Fed will not rush, preferring to evaluate data as it comes in
Average $SPX Returns (All Cycles 1985-2024):

1-month: +1.5%
3-month: +3.5%
12-month: +10.2%

Historically, the stock market's response to Federal Reserve interest rate cutting cycles has varied depending on the economic conditions that prompted the cuts. However, the overall tendency is for the S&P 500 ($SPX) to perform positively in the months following a rate cut, particularly as markets anticipate easier monetary conditions to support economic growth. Below, I'll provide a summary of historical data on how the S&P 500 performed after interest rate cutting cycles since 1985, followed by individual cycles and their performance over 1-month, 3-month, and 12-month time frames.

Interest Rate Cutting Cycles:

1985-1986 Cutting Cycle (Sep 1985 - Aug 1986) Trigger: Slowing economy after early 1980s inflation.
1-month: +2.0%
3-month: +4.0%
12-month: +23.7%

1989-1990 Cutting Cycle (Jun 1989 - Dec 1990) Trigger: Response to rising unemployment and slowing growth.
1-month: +0.5%
3-month: -3.8%
12-month: -2.9%

1995-1996 Cutting Cycle (Jul 1995 - Jan 1996) Trigger: Mid-1990s economic slowdown.
1-month: +1.7%
3-month: +7.2%
12-month: +18.9%

1998 Cutting Cycle (Sep 1998 - Nov 1998) Trigger: Russian default and LTCM collapse.
1-month: +6.0%
3-month: +19.3%
12-month: +31.7%

2001-2002 Cutting Cycle (Jan 2001 - Nov 2002) Trigger: Dot-com bubble burst, 9/11 attacks.
1-month: +2.2%
3-month: +3.8%
12-month: -18.3%

2007-2008 Cutting Cycle (Sep 2007 - Dec 2008) Trigger: Global financial crisis.
1-month: -0.5%
3-month: -11.8%
12-month: -37.0%

2019 Cutting Cycle (Jul 2019 - Oct 2019) Trigger: Global growth slowdown, trade tensions.
1-month: +0.6%
3-month: +6.6%
12-month: +14.7%

2020 Pandemic Cutting Cycle (Mar 2020) Trigger: COVID-19 pandemic economic shutdown.
1-month: -8.8%
3-month: +21.5%
12-month: +68.4%

2023-2024 Cutting Cycle (Sep 2024 onward) (pending future outcomes)

Key Insights:
Short-term response (1-month): Stock market reactions are mixed, but there is a mild positive bias (+1.5% average). Notable exceptions were during severe financial crises like 2007 and 2020, when the market had a negative 1-month response to rate cuts.

Intermediate-term response (3-month): The S&P 500 tends to perform better over a 3-month horizon after rate cuts, averaging +3.5%. This is a sign that markets begin pricing in the positive effects of lower interest rates, particularly when the cuts are meant to stimulate growth.

Long-term response (12-month): The best returns tend to be over a 12-month horizon, averaging +10.2%. Historically, 12-month performance was particularly strong in the 1995 and 1998 cycles, but weaker in more extreme economic downturns, such as 2001 and 2007.
In general, when rate cuts are made in response to slowing growth but not a full-blown crisis (e.g., 1995 or 1998), the stock market tends to perform well.

However, in more severe economic environments (2001, 2008), the positive effects of rate cuts are not immediately felt, and the stock market can experience continued weakness.

The current 2024 cycle, with the 50 bps cut in September, follows a mixed economic outlook (moderating growth but stable inflation), so the performance could align more closely with "mild slowdown" periods like 1995 or 2019, where cuts preceded solid market performance.
There have been several instances where the Federal Reserve initiated a rate cut while the S&P 500 ($SPX) was near all-time highs. These periods typically occurred when the Fed shifted from a tightening to an easing cycle, despite relatively strong market performance. Below are some notable instances:

1.  July 1995

Context: The Federal Reserve cut rates in July 1995 as the economy showed signs of slowing after a period of tightening. The S&P 500 was trading near all-time highs at the time, as the stock market had been performing well.
Market Reaction: Following the rate cuts, the market rallied further, with the S&P 500 posting strong gains over the next year.

2.  September 1998

Context: Despite being near record highs in July 1998, the Fed cut rates in response to the Russian debt crisis and the collapse of Long-Term Capital Management (LTCM), which created fears of systemic risk. While the stock market dipped briefly, the S&P 500 was still elevated near its highs compared to past years.
Market Reaction: The S&P 500 rebounded strongly after the rate cuts, with one of the best-performing 12-month periods following a rate cut (up over 30%).

3.  July 2019

Context: The Fed began cutting rates in July 2019, following a long tightening cycle that ended in 2018. The S&P 500 was near all-time highs, driven by solid corporate earnings and the market's anticipation of looser monetary policy.
Market Reaction: The S&P 500 continued to climb after the initial cut, gaining around 14.7% over the next 12 months, despite some volatility from global trade tensions and slowing economic growth.

4.  July 1997

Context: This was during the late 1990s bull market when the S&P 500 was regularly reaching new highs. Although the Fed wasn’t engaged in significant rate cutting, there were periods of temporary rate adjustments amid a booming stock market.
Market Reaction: The market continued to perform well as growth remained strong and inflation was low.
Key Insights from These Instances:

Rate cuts near market highs often signal a shift in policy in response to external risks or economic moderation, rather than a full-blown crisis.
Short-term caution: In some cases, there is initial volatility following a rate cut, as investors process the reasoning behind the cut, but in the examples noted above, the long-term market reaction has been positive.
Market anticipation: In these instances, the market tends to anticipate rate cuts, so the S&P 500 continues to climb or remain near highs even as the Fed loosens monetary policy.
The 2019 example is particularly relevant to 2024, where the Fed is easing policy despite a relatively resilient stock market, suggesting that stock prices may still have upside potential if economic risks are managed successfully.
Read 12 tweets
Aug 2
Hello Friday! 🥷

I don't know if it's the unwind of the Yen 💹 carry trade, the change in vol 🌊 regime , or a Fed that's too #tight in the face of weak economic date, but risk assets are getting pummeled 🗡️🩸

I doubt $NFP will save us

Let's dig into the market 🧮!
Asia 🗡️🩸

$NIKK 35912 -5.75% ⬅️ 🙀
$SSEC 2905 -0.9%
$HSI 16946 -2.1%
$KOSPI 2676 -3.65% ⬅️ 😮
$IDX 7311 -0.2%

Australia ↘️
$ASX 7943 -2.1%

Bharat ↘️
$BSE 81182 -0.85%
Europe ↘️

$VSTOXX 20.92 🔺

$DAX range = 17862 - 18711 ♉️ to ↔️ 🆕
$FEZ range = 48.65 - 50.71 ↔️ to 🐻 🆕

$DAX 17898 -1.05%
$FTSE 8264 -0.25%
$CAC 7342 -0.4%
$AEX 893 -1.6%
$IBEX 10818 -0.35%
$MIB 32427 -1.3%
$SMI 12013 -2.45% ⬅️ 😬
$MOEX 2918 -0.6%
Read 13 tweets
May 23
Hello Thursday!

With FOMC 🏦 minutes 📓 (nothing 🍔 that gave you a #BTFD moment) and $NVDA 🚀 out of the way, the $VIX (along with metals and the $USD) is collapsing

This is unequivocally ♉️ equities

Let's dig into the market 🧮!
Asian #dispersion ⬆️ ⬇️

$NIKK 39112 +1.3% ⬆️
$SSEC 3116 -1.35% ⬇️
$TWSE 21552 unch
$HSI 18869 -1.7% ⬇️
$KOSPI 2722 -0.05%
$IDX 7221 +0.5% ⬆️

Australia ↘️
$ASX 7812 -0.45%

Bharat ↗️
$BSE 74955 +1.0%
Europe trying to bounce ↔️

$VSTOXX 12.37 🔻

$DAX range = 18436 - 19085 ♉️
$FEZ range = 52.32 - 54.53 ♉️

$DAX 18695 +0.05%
$FTSE 8348 -0.25%
$CAC 8102 +0.1%
$AEX 915 +0.5%
$IBEX 11314 -0.15%
$MIB 34411 -0.15%
$SMI 11979 +0.25%
$MOEX 3417 -0.8%
Read 11 tweets
May 5
🐻♉️↗️↘️↔️⚠️🚩🔺🔻🧮 💰

Something strange happened in #macro markets this week 🧵 1/7

Inflation data pushed  🔺 and the #TRA pointed to coupon issuance 🔺, yet inflation assets sold off 🔻 and bonds caught a bid 🔺

Let’s dig into the 🧮!
2/7

Data and policy palooza this past week supported a phase transition to #stagflation
3/7

First the #inflation data

#ECI +1.1% 🔺
CS Home Price +7.3% y/y 🔺
#ISM Manufacturing Prices 60.9 🔺
Unit Labor Costs +4.7% 🔺
#ISM Services Prices 59.2 🔺
#AHE Y/Y +3.9% 🔻 ⬅️

Together with April #CPI 🔺 and #PCE 🔺, inflation acceleration is trending 🔺
Read 7 tweets
Mar 7
Hello Thursday!

"BOJ Board Member Nakagawa Says Japan Moving Steadily Toward Achieving Price Goal" and the $USDJPY rolls again…

Let's dig into the market 🧮!

wsj.com/articles/boj-b…
Image
Asia closed ↔️ with $NIKK ↘️ 🥷

$NIKK 39598 -1.3%
$SSEC 3027 -0.4%
$TWSE 19694 +1.0% ⬅️
$HSI 16239 -1.25%
$KOSPI 2648 +0.25%
$IDX 7369 +0.55%

Australia ↗️
$ASX 7764 +0.4%

Bharat ↔️
$BSE 74073 unch
Europe trading ↔️

$DAX 17671 -0.3%
$FTSE 7657 -0.3%
$CAC 7941 -0.2%
$AEX 859 +0.2%
$IBEX 10254 +0.55%
$MIB 33333 -0.1%
$SMI 11497 -0.45%
$MOEX 3306 -0.15%

$VSTOXX 14.27

$DAX range = 17306 - 17919 ♉️
$FEZ range = 49.79 - 51.89 ♉️
Read 11 tweets
Feb 19
Hello Presidents Day!

The 🇺🇸 is closed for the holiday but 🇨🇳 is back after making 🥳 with the 🐉 for the past week

Let's dig into the market 🧮!
In Asia, the $NIKK finding overhead near ATHs after a ♉️ breakout run to 38500

$NIKK 38470 -0.1%
$SSEC 2911 +1.55% 🇨🇳
$TWSE 18636 +0.15%
$HSI 16156 -1.15%
$KOSPI 2680 +1.2%
$IDX 7297 -0.55%

Australia ↔️
$ASX 7665 +0.1%

Bharat ↗️
$BSE 72718 +0.4% Image
Europe ↔️ stalling at ATHs

$DAX 17065 -0.3%
$FTSE 7717 +0.05%
$CAC 7739 -0.4%
$AEX 855 -0.3%
$IBEX 9927 +0.4%
$MIB 31635 -0.3%
$SMI 11327 +0.15%
$MOEX 3247 +0.13%

$VSTOXX 14.62 🔺

$DAX range = 16922 - 17258 ♉️
$FEZ range = 48.13 - 49.50 ♉️ Image
Read 10 tweets

Did Thread Reader help you today?

Support us! We are indie developers!


This site is made by just two indie developers on a laptop doing marketing, support and development! Read more about the story.

Become a Premium Member ($3/month or $30/year) and get exclusive features!

Become Premium

Don't want to be a Premium member but still want to support us?

Make a small donation by buying us coffee ($5) or help with server cost ($10)

Donate via Paypal

Or Donate anonymously using crypto!

Ethereum

0xfe58350B80634f60Fa6Dc149a72b4DFbc17D341E copy

Bitcoin

3ATGMxNzCUFzxpMCHL5sWSt4DVtS8UqXpi copy

Thank you for your support!

Follow Us!

:(