#BustingMyths #ForexReserves #Modinomics #MUSTREAD
Judging a Country based on its #ForexReserves is like Judging a Persons Networth based on his #SavingAccount balance & not his #LoanAccount balance.
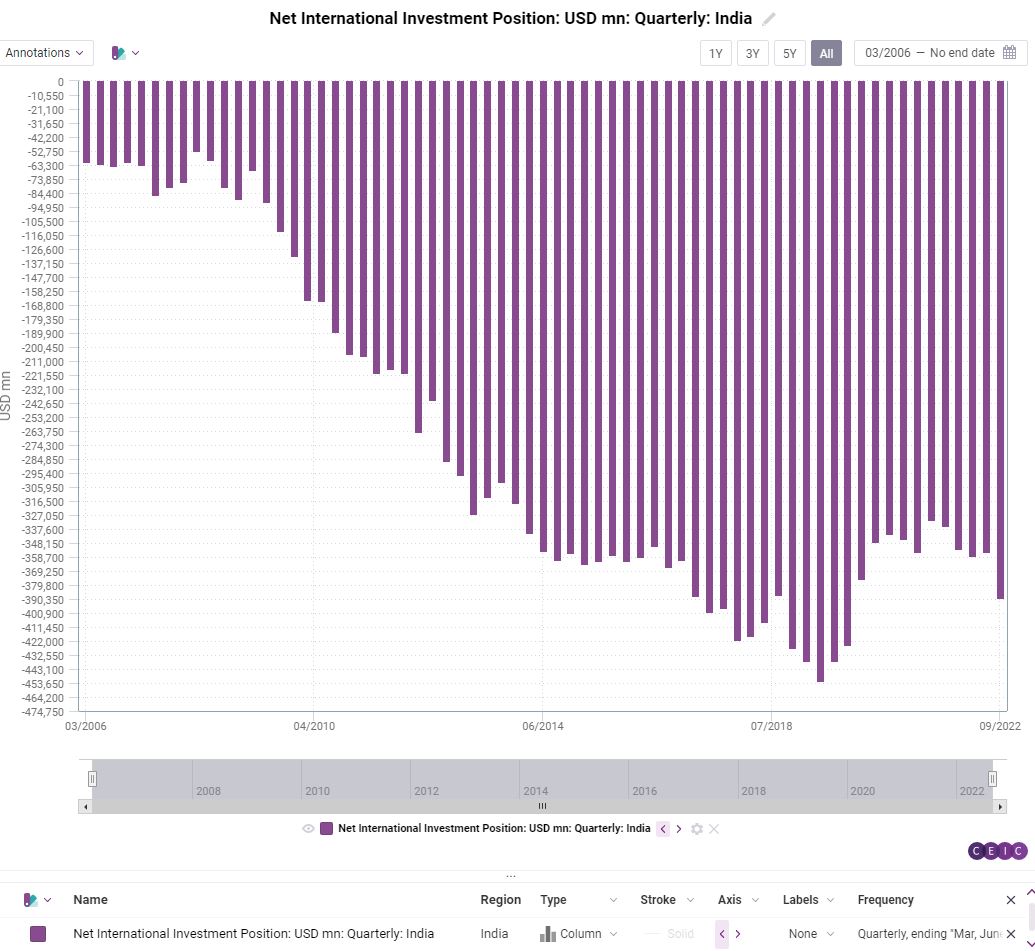
Judge #Modinomics on #NIIP (-ve $390bn)
And Not on FX Reserves (+ve $506bn)

Judging a Country based on its #ForexReserves is like Judging a Persons Networth based on his #SavingAccount balance & not his #LoanAccount balance.
Judge #Modinomics on #NIIP (-ve $390bn)
And Not on FX Reserves (+ve $506bn)


So what is #NIIP or Net International Investment Position. Let me quote @FinMinIndia Economic Survey
NIIP is the difference b/w an Economy’s External financial Assets & Liabilities.
If Economy = Person, NIIP is Assets (Property, Deposits, Investments) less Liabilities (Loans)
NIIP is the difference b/w an Economy’s External financial Assets & Liabilities.
If Economy = Person, NIIP is Assets (Property, Deposits, Investments) less Liabilities (Loans)

As per FY23 Economic Survey released by @FinMinIndia before budget, India's overseas financial ASSETS at US$ 847.5bn but India's International LIABILITIES was higher at US$ 1,237.1Bn
Assets ($847.5) LESS Liabilities ($1237.1Bn) = NEGATIVE $389.6Bn
STOP LOOKING AT FX RESERVES
Assets ($847.5) LESS Liabilities ($1237.1Bn) = NEGATIVE $389.6Bn
STOP LOOKING AT FX RESERVES

NIIP: When compared to other Countries like
China,
Japan,
S Korea,
Singapore
Germany
UK
US
Russia
Brazil
Indonesia
Bangladesh
Brazil is the Worst, Followed by India.
China,
Japan,
S Korea,
Singapore
Germany
UK
US
Russia
Brazil
Indonesia
Bangladesh
Brazil is the Worst, Followed by India.

NOTE: Forex (FX) Reserves is like CASH in your Savings or Current Account. Its a sign of how much LIQUIDITY you have. It does NOT show you how much your NET WORTH is. For that you have to consider External Loans or Liabilities. 

Since some of these LOANS or LIABILITIES might have to be paid immediately,
Another way to look at our FX Reserves is to look at HOW MANY MONTHS of IMPORT COVER India have. Here is a long Term Chart.
As you can see, Indias Months of Import Cover has fallen in to 10 months.
Another way to look at our FX Reserves is to look at HOW MANY MONTHS of IMPORT COVER India have. Here is a long Term Chart.
As you can see, Indias Months of Import Cover has fallen in to 10 months.

Now Lets Look at the Months of IMPORT cover (Purple) along with the Foreign Exchange (Green) ..... Hope you get the point. 

• • •
Missing some Tweet in this thread? You can try to
force a refresh


