1/ Epidemiology is a critical field in public health, and R is a popular programming language for epidemiologists to analyze and visualize data. In this thread, I'll highlight some essential epidemiology packages in R that you should know. #rstats#datascience#epidemiology
2/ The first package that comes to mind is "epitools." This package provides a suite of functions for descriptive epidemiology, including measures of disease frequency, tests for independence, and outbreak detection. #rstatscran.r-project.org/web/packages/e…
3/ "EpiModel" is another package that is useful for epidemiologists. This package allows you to build mathematical models of infectious diseases and simulate the spread of diseases through populations. #rstatscran.r-project.org/web/packages/E…
4/ "EpiEstim" is another package that is gaining popularity in the epidemiology community. It provides tools for estimating time-varying reproduction numbers (Rt) from epidemic data. #rstatscran.r-project.org/web/packages/E…
5/ "surveillance" is a package that allows for the detection of outbreaks in surveillance data. It includes functions for calculating outbreak thresholds and for generating outbreak alerts. It's a powerful tool for public health surveillance. #rstatscran.r-project.org/web/packages/s…
6/ "outbreaker2," is designed specifically for analyzing outbreak data. It includes functions for estimating outbreak parameters such as the incubation period and the serial interval. It also allows for the visualization of outbreak dynamics. #rstats cran.r-project.org/web/packages/o…
7/ 'Epi' provides functions for analyzing epidemiological data, including cohort and case-control studies. It includes functions for calculating measures of association, such as odds ratios and relative risks. #rstatscran.r-project.org/web/packages/E…
• • •
Missing some Tweet in this thread? You can try to
force a refresh
1/10: 🧵 Welcome to this thread on #regression modeling strategies in #R! We'll discuss key techniques and packages to help you build effective models. Ready to dive in? Let's go! 🚀 #RStats#DataScience#Statistics
2/10: 🌐 Linear Regression: Start with simple & multiple linear regression using 'lm()' function. Check out the 'broom' package for easy-to-use regression output! #RStatscran.r-project.org/web/packages/b…
3/10:🏞️ Polynomial Regression: When data is nonlinear, try polynomial regression! Use 'poly()' to create higher-order terms. Beware of overfitting! #RStats
1/ Bioinformatics is an essential part of modern biology, and R is a powerful programming language that has become the standard tool for bioinformatics analysis. #rstats#bioinformatics#datascience
2/ R provides an extensive collection of packages for bioinformatics analysis, including tools for gene expression analysis, sequencing data analysis, and network analysis. #rstats#bioinformatics
3/ Bioconductor is an open-source software project that provides tools for the analysis and comprehension of genomic data. It contains more than 1,800 packages for bioinformatics analysis. #rstats#bioinformatics
1/ Regularization methods are a crucial part of machine learning models that help to prevent overfitting. In R, there are several popular regularization methods available, including Lasso, Ridge, and Elastic Net. #rstats#datascience#MachineLearning
2/ Lasso (Least Absolute Shrinkage and Selection Operator) is a method that uses L1 regularization to shrink the coefficients of less important features to zero, resulting in a sparse model. It is useful when there are many features with only a few of them being relevant. #rstats
3/ Ridge regression, on the other hand, uses L2 regularization to add a penalty term to the loss function that shrinks the coefficients of less important features towards zero without setting them to zero. It is useful when all features are potentially relevant. #rstats
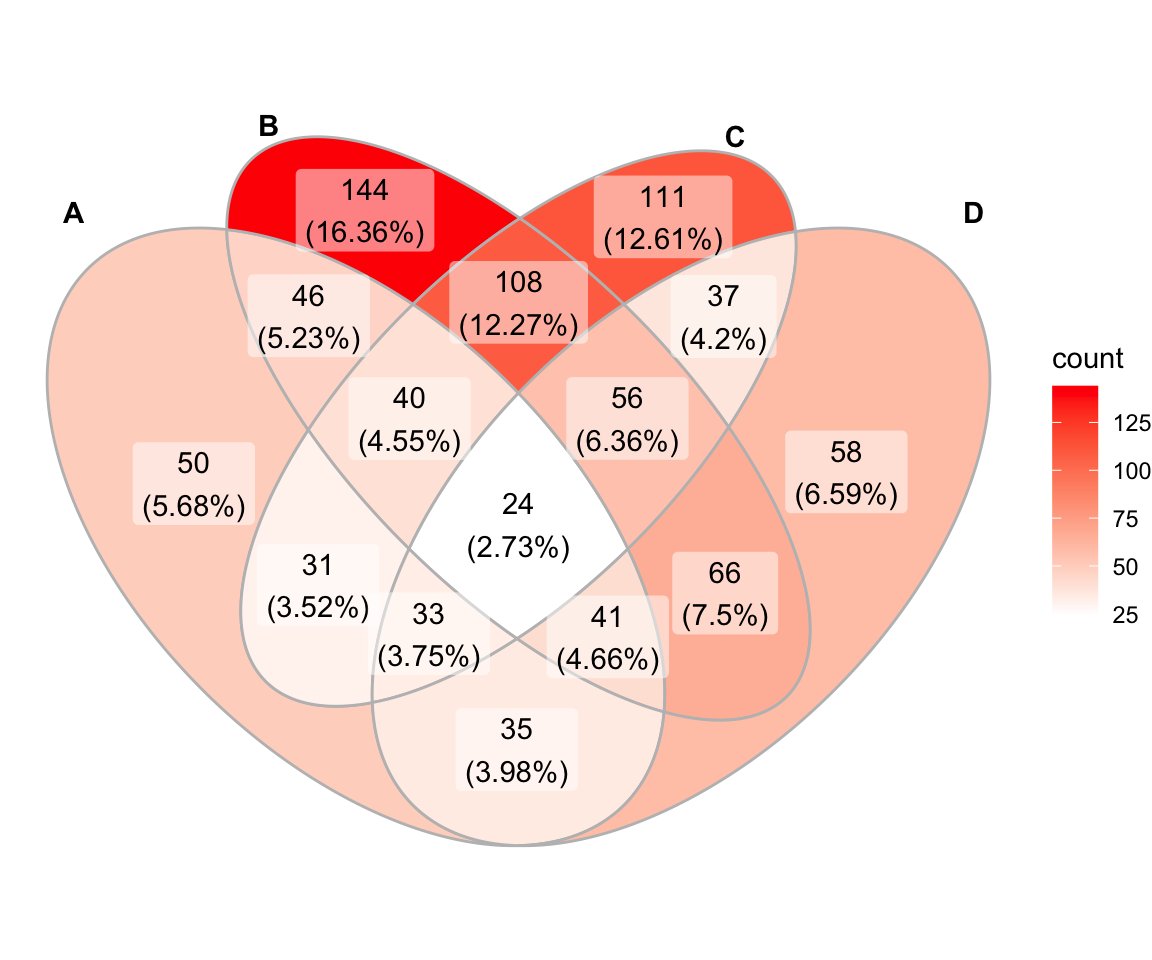
1/6: Venn diagrams are commonly used in bioinformatics to visualize the overlap of different sets of genes or proteins. There are several R packages available for creating these diagrams, including VennDiagram, ggvenn, and ggVennDiagram. #rstats#datascience#bioinformatics
2/6: VennDiagram is a widely used package for creating classic Venn diagrams with up to six sets. It offers a range of options for customizing the appearance of the diagram, including font size, color, and label placement. #rstats#bioinformatics
3/6: One of the advantages of VennDiagram is the ability to easily incorporate statistical analyses. For example, you can calculate the significance of the overlap between different sets of genes or proteins and display this information on the diagram. #rstats#bioinformatics
1/ Mixed models are a powerful statistical tool for analyzing complex data with both fixed and random effects. R has several great packages for fitting mixed models. #rstats#datascience
2/ One of the most popular packages for mixed models in R is "lme4". This package provides functions for fitting linear and generalized linear mixed models, including models with crossed and nested random effects. #rstats#lme4cran.r-project.org/web/packages/l…
3/ Another popular mixed model package in R is "nlme". It has similar functionality to "lme4" but is designed to handle longitudinal or repeated-measures data. #rstats#nlmecran.r-project.org/web/packages/n…
1/ If you're designing experiments, check out the "randomizeR" package in R! It helps you create randomized experimental designs, which can be crucial for avoiding bias and ensuring your results are statistically sound. #rstats#datasciencecran.r-project.org/web/packages/r…
2/ Another helpful package is "DoE.base", which offers a wide range of tools for design and analysis of experiments. You can use it to create custom designs, analyze data, and more. #rstats#datasciencecran.r-project.org/web/packages/D…
3/ "FrF2" is another package you'll want to consider for experiment design. It helps you create fractional factorial designs, which can save time and resources while still giving you the information you need. #rstats#datasciencecran.r-project.org/web/packages/F…