Marko Bjegovic Profile picture
Jun 2, 2023 11 tweets 6 min read Read on X
May employment report came in mixed with both NFP and UR increasing.

Again, no Wall Street analyst came nowhere close to guessing the headline number with the highest estimate missing it by 129K.

What does that all mean for the #Fed?

A thread.

1/11
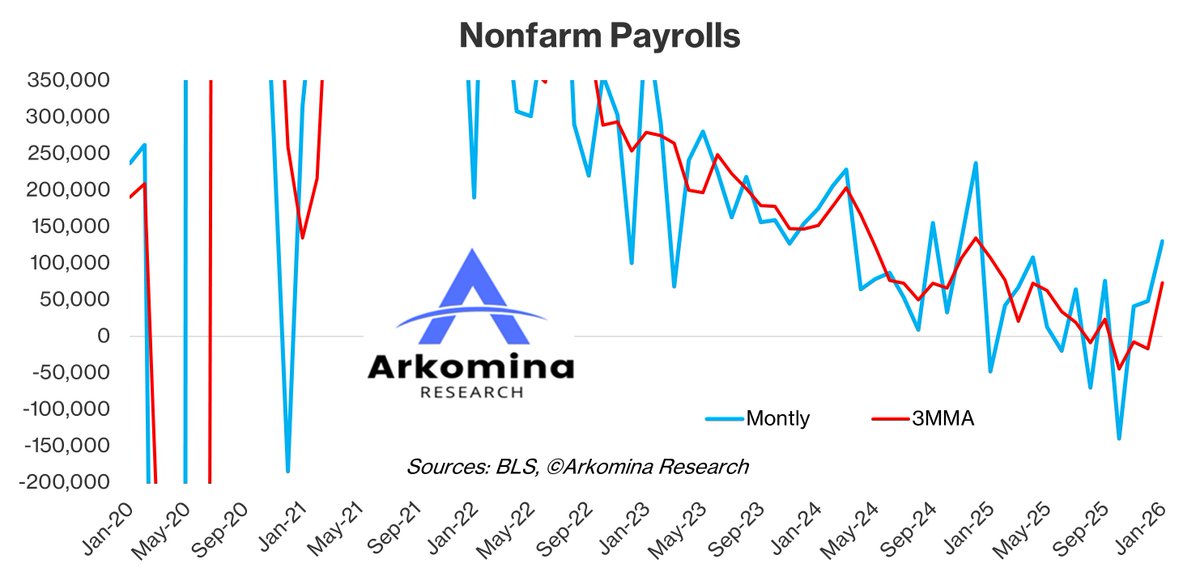
NFP rose for the 29th M in a row with +339K which is 149K above consensus (+190K).

Apr number was revised up by 41K from +253K to +294K.

Total gain in Apr and May is +633K, 190K higher than expected (+443K).

#employment

2/11
At the same time UR jumped from 3.4% (cycle low) to 3.7%, the highest since Feb 2022 and the same as in Aug and Oct 2022.

#unemployment

3/11 Image
0.3 pp jump in UR is highly intriguing.

It is literally the highest jump in UR since Apr 2020 when the #economy was in a deep #recession caused by lockdowns.

Before that we had 1M jumps of that magnitude in 2008, before that in 2001... you get the pattern.

#unemployment

4/11 Image
In the details, gains were almost across the board with only manufacturing and IT recording net layoffs.

There was a noticeable pick-up in construction, transportation, education and health, leisure and hospitality, and government.

#employment

5/11 Image
AHE were up +0.3% or +3.96% annualized while Apr was revised down from +0.5% or +5.8% annualized to +0.4% or +4.7% annualized.

As I expected a M ago, they did end up revising Apr number down.


6/11 Image
AHE is now closer to where the #Fed wants it to be, maybe a still a bit above the desired level.

However, there is a possibility we end up seeing further downside revisions in AHE sometime in the M ahead.

7/11 Image
What does that all mean for the #Fed?

This report supports a pause bc +0.3 pp upside in UR can be worrisome, especially if it persists.

As I explained in my macro/market analyses (Marko's Brain Daily),

I don't think the #Fed will use this report when deciding rates.

8/11
Still, I think they will pause in 2W due to some other reasons mostly related to balancing a tricky path trying not to break anything in the coming W and M.

Now we come to the most important Q of them all - what will the #Fed do later in the year?

9/11
These threads take a lot of time and effort to make.

If you like the content, please love and retweet tweets in this thread to help me spread the message.

Thank you!

10/11
I'm currently writing my premium

Marko's Fed Report

where I'll, among other things, offer a detailed overview of the #Fed's actions going forward as well as when will the MP lags finally bite into the economy.

If you want to get it, message me.

11/11 Image

• • •

Missing some Tweet in this thread? You can try to force a refresh
 

Keep Current with Marko Bjegovic

Marko Bjegovic Profile picture

Stay in touch and get notified when new unrolls are available from this author!

Read all threads

This Thread may be Removed Anytime!

PDF

Twitter may remove this content at anytime! Save it as PDF for later use!

Try unrolling a thread yourself!

how to unroll video
  1. Follow @ThreadReaderApp to mention us!

  2. From a Twitter thread mention us with a keyword "unroll"
@threadreaderapp unroll

Practice here first or read more on our help page!

More from @MBjegovic

Nov 14
Oct #CPI yesterday came in line with market expectations.

After seeing both headline and core CPI rise YoY some concluded that the #inflation progress has stalled or that inflation is picking back up.

None of that is true.

Here is why.

A CPI thread.

1/12
Compared to my estimates Oct #CPI was:

Headline
+0.24% MoM, +4 bps above my estimate
+2.60% YoY, +5 bps above my estimate

Core
+0.28% MoM, +2 bps above my estimate
+3.33% YoY, -2 bps below my estimate

My Oct CPI estimates were published 2 days before
the actual CPI print and are available (no paywall) at this link:

2/12open.substack.com/pub/arkominare…
Headline #CPI came in at +0.24% MoM, the highest MoM read in 6 months, but still enough to be rounded to +0.2% and even below what was typical pre-2020.

#inflation

3/12Image
Read 12 tweets
Nov 2
Many believe hurricanes and strikes are making the Oct Employment Report look weaker than it actually was.

However, that's not what the data is telling us.

I will explain why in a thread.

1/12
+12K NFP is the weakest job growth since the last negative print in Dec 2020.

This is also the 2nd lowest read since Apr 2020 (last official #recession).

Again we saw some big negative revisions for prior 2 months which totaled -112K.

In the first 9 months of this yr NFP were revised down by a total of -405K or -45K on avg.

7 out of 9 months in 2024 were revised down.

The only exceptions are Mar and Jul.

Jul number had hurricane Beryl effect.

Since Oct number was most likely affected by 2 hurricanes (Helene and Milton), maybe we will also see some upward revisions for Oct in the coming months.

Even so, Oct could end up negative after all revisions are done.

How is that possible?

I will explain further in the thread.

2/12Image
Image
Strikes likely had a negative effect of around -40K (33K $BA workers on strikes + potentially some workers in other firms involved directly in BA's manufacturing process).

However, this effect is unlikely to get revised away in full, if at all.

Regarding hurricanes, we know that 512K workers (NSA) did not show up for work in Oct due to the bad weather (hurricanes Helene and Milton), which is a bit more than in Jul (461K) during the hurricane Beryl.

Jul was revised up by +30K which could mean that Oct might get revised up by a bit more, say by around +40K.

If that's the case, the Oct NFP could end up somewhere in the 50Ks.

And if that happens, we have a serious risk of the number actually ending up negative after annual revisions.

Remember that the last revisions for Apr 2023 - Mar 2024 showed that job gains were overstated by about 68K per month on avg so applying that to Oct NFP gets us to a negative number even AFTER the likely upward monthly revisions.

3/12Image
Read 12 tweets
Oct 13
I'm late to address Sep #CPI but I'm sure you'll love what you're about to see.

Some have suggested #inflation may be reaccelerating due to which the #Fed should pause cuts, but the details show there are no signs of reacceleration.

I'll explain why in a CPI thread.

1/12
Sep #CPI was not far for my MoM estimates, but it came higher than my YoY estimates.

That said, consensus estimates were further away than my forecast.

Headline
+0.18% MoM vs +0.15% my estimate so +3 bps above
+2.44% YoY vs +2.31% my estimate so +13 bps above

Core
+0.31% MoM vs +0.33% my estimate so -2 bps below
+3.31% YoY vs +3.20% my estimate so +11 bps above

My estimates were published a day prior to the official CPI release on Substack (a week before in Marko's CPI Report) and can now be accessed for free on this link:
arkominaresearch.substack.com/p/sep-2024-cpi…

#inflation

2/12
Let's start with a positive thing.

Headline #CPI at +0.18% MoM marks a 5th low MoM (sub-0.20%) read in a row which hasn't happened since the 2010s.

Furthermore, over the past 5 months headline MoM was even lower than in 2019.

#inflation

3/12 Image
Read 12 tweets
Oct 7
By now you've probably heard a lot about how great Sep Employment Report was.

However, the data disagrees with that telling us not only it wasn't "great", but it was so weak that it points to a #recession.

I'll explain why in a thread.

1/11
+254K NFP in Sep coming after +159K in Aug which was revised upward from initial +142K, seems like a great jobs growth.

This means the economy is still going strong, everything is fine, the labor mkt is nowhere near falling off a cliff, right?

Not so fast.

When looking under the hood, we are talking about #recession-ary NFP.

Yes, you read that right.

Explanation follows.

2/11Image
Namely, the seasonal factor in Sep 2024 was the highest of any Sep on record (data going back to 1939).

The reported NFP of +254K is clearly far from actual.

How far?

As far as a pie in the sky.

If the seasonal factor in 2024 was the same as Sep 2023, NFP would be +145K (that's more than -100K below the reported number).

If the seasonal factor in 2024 was the same as the 2007-2019 avg, NFP would be +35K (that's more than -200K below the reported number), which is among the lowest reads during that period.

The lowest ones were negative reads 2008-2010 and if the seasonal factor in 2024 was the same as the 2008-2010 average, NFP would be, prepare yourself, NEGATIVE -78K, which is well #recession-ary and more than -300K below the reported number.

And that's before normal (likely downward) revisions we will likely see in the coming months and quarters.

If we would factor in likely downward revisions (monthly + annual), we could easily be looking at close to -200K in Sep, yes you read that right.

Is that a "great" jobs growth like almost every1 described it?

Not by any stretch of the imagination.

3/11Image
Read 11 tweets
Sep 7
I'm a little late to address the Aug Employment Report but I'm sure you will love what you're about to see here.

The employment report shows further labor market weakening adding to #recession fears.

NFP weaker than expected with big prior 2-month downward revisions
UR edged down (barely) in line with expectations
AHE came in slightly hotter than expected

The #Fed hopes to see no further slowing in the labor mkt.

How plausible is that?

An employment thread.

1/11
Aug #NFP came in at +142K, the 5th lowest month since Dec 2020.

3 of 4 months that are lower than Aug came in the last 5 months.

Jul (+89K) was the lowest since Dec 2020.

In the last 3 months NFP averaged only +116K which is the lowest 3-month avg since Jun 2020.

As a reminder, Jun 2020 was still influenced by the last severe #recession in 2020 induced by the first lockdowns.

It seems hard to imagine that just a few months ago we thought the economy was adding 250K-300K jobs per month.

After downward revisions and recent weaker monthly reads, situation has changed.

Almost all of the months in 2024 were revised down so far (save Mar) with a total downward revision of -365K.

To put things into perspective, that's more than 2.5 times larger than Aug NFP.

2/11Image
Image
Now we come to the most interesting part.

There is a high chance that Aug NFP also gets revised down.

If we assume that it will be revised down by the average downward revisions so far in 2024 (-52.1K) we come to only +90K.

And that's before CES annual revisions.

If CES annual revisions in 2024 are the same as in 2023 (-68.2K per month on average), we could be looking at only +22K roughly in Aug.

If Aug ends up anywhere near +22K after all is said and done, these levels would be outright #recession ary.

Now, downward revisions could also be less than avg so let's say they are "just" -25K like in Jul, we would still be looking at +49K, levels that happened both just before and in many last recessions.

So current NFP levels are actually quite concerning.

3/11
Read 11 tweets
Apr 10
At first glance Mar #CPI looks hot.

Some have even said the #Fed should hike rates from here based on the last 3 months of CPI.

Is #inflation reaccelerating?

Let's delve into details.

A CPI thread.

1/9
Headline (+3.477% YoY) and core #CPI (+3.801%) were 8 bps and 7 bps higher than I expected respectively.

My Mar estimate is available here (for free): .

My CPI estimates remain exceptionally accurate with an average error of -2 bps for headline and -4 bps for core.

#inflation

2/9substack.com/home/post/p-14…Image
Image
Headline #CPI was again up +0.6% MoM NSA, double of what we had in Mar 2023, but still lower than both Mar 2022 (+1.3%) and Mar 2021 (+0.7%).

The strength came from:
1) gasoline prices,
2) seasonality and
3) couple of lagged components.

Gasoline prices added +21 bps, shelter added another +21 bps and motor vehicle insurance added another +8 bps to the headline CPI.

So, +50 bps MoM came from just these 3 components where:
gasoline prices are volatile and could be up one month and down another,
shelter is showing persistent numbers that have no foundation in the real world, and
motor vehicle insurance unexpectedly went up by the most since mid-2020 making Mar the 10th largest MoM jump on record (data going back to 1969).

These 3 components make about 40% of the CPI but were responsible for almost 80% of its MoM gain in Mar.

You know where I'm getting at...

The majority of the index (roughly 60%) is only up +0.1 pp NSA which is negative SA (#deflation).

So, not only #inflation is not accelerating but it was down further from Feb.

Headline was only +3 bps above what was expected.

Unexpectedly high increase in motor vehicle insurance alone is responsible for the headline CPI miss.

3/9Image
Read 9 tweets

Did Thread Reader help you today?

Support us! We are indie developers!


This site is made by just two indie developers on a laptop doing marketing, support and development! Read more about the story.

Become a Premium Member ($3/month or $30/year) and get exclusive features!

Become Premium

Don't want to be a Premium member but still want to support us?

Make a small donation by buying us coffee ($5) or help with server cost ($10)

Donate via Paypal

Or Donate anonymously using crypto!

Ethereum

0xfe58350B80634f60Fa6Dc149a72b4DFbc17D341E copy

Bitcoin

3ATGMxNzCUFzxpMCHL5sWSt4DVtS8UqXpi copy

Thank you for your support!

Follow Us!

:(