glassnode Profile picture
Jun 5 4 tweets 4 min read Twitter logo Read on Twitter
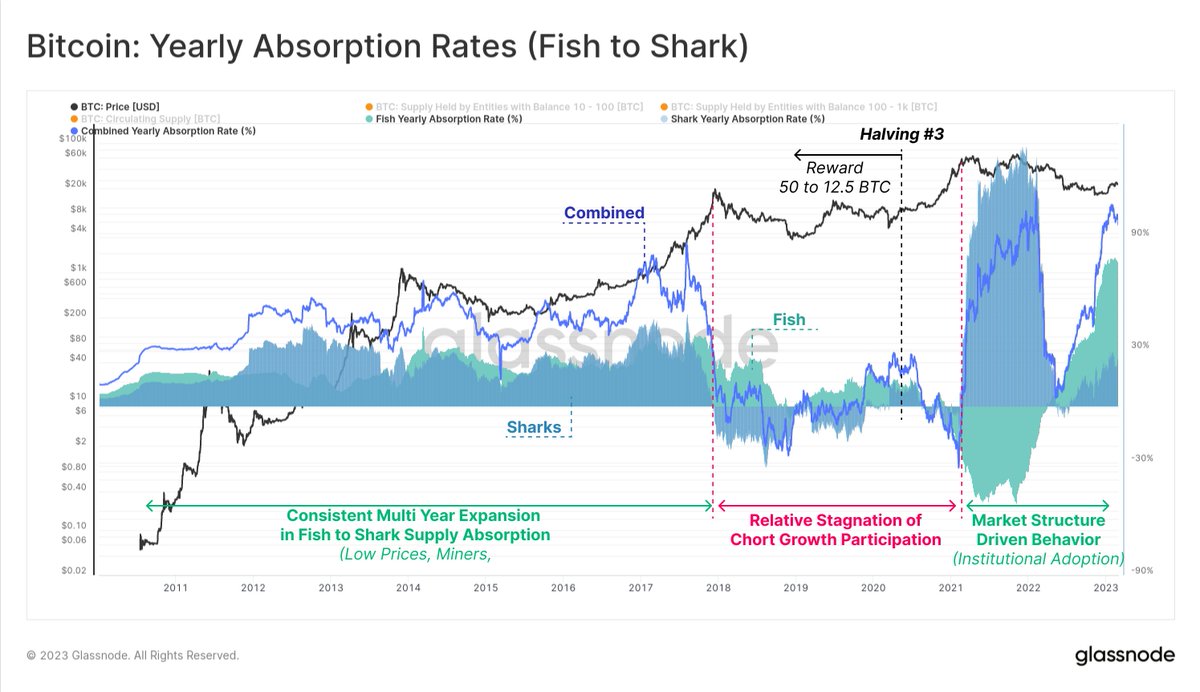
Dominance of #Bitcoin supply has seen a dramatic shift over the last two years.

US entities are now holding 11% less $BTC than they were in June 2022, whilst investors active during Asian trading hours have picked up 9.9%.

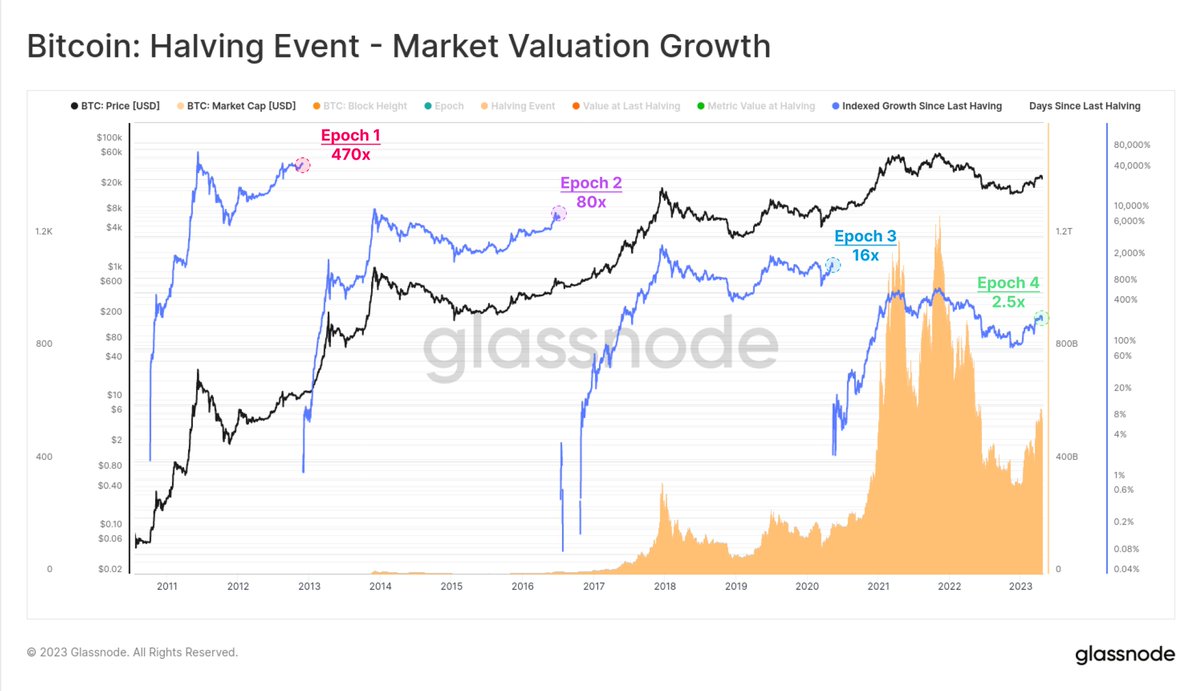
This is a distinct reversal from the 2020-21 bull cycle Image
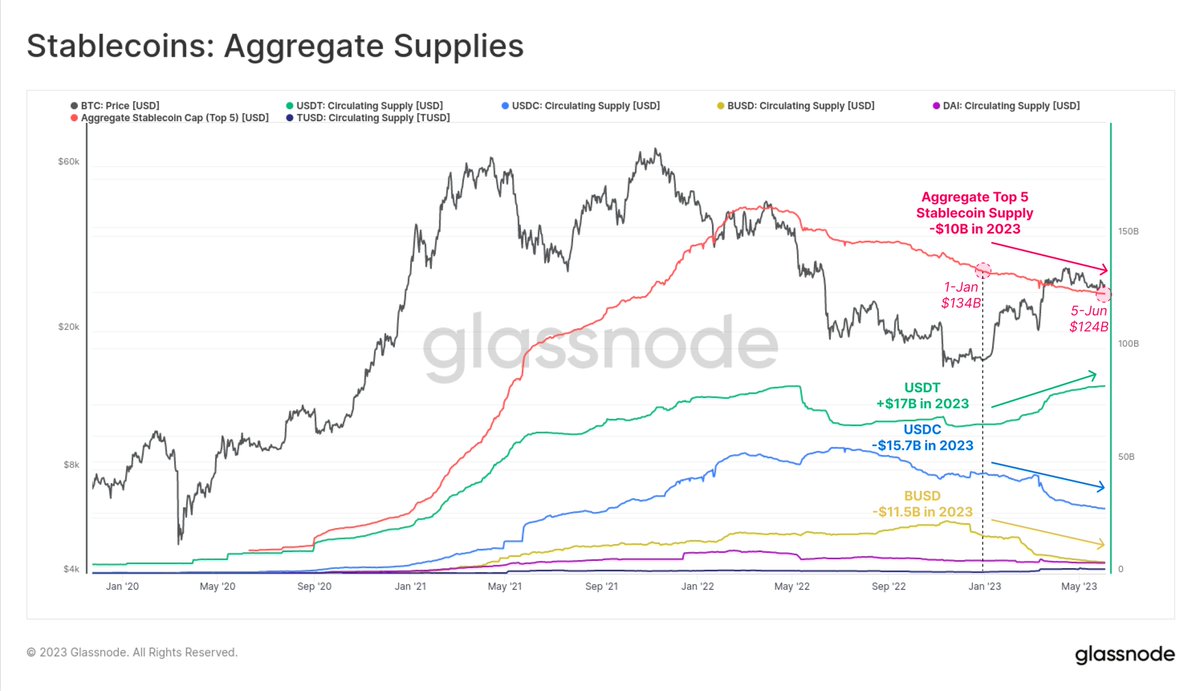
We can see major shifts underway in stablecoins, with #USDT supply at new ATHs, whilst #USDC and #BUSD fall to multi-year lows.

Given stablecoins are non-interest-bearing, and regulatory pressure in US is building, it suggests US capital is now less active in digital assets. Image
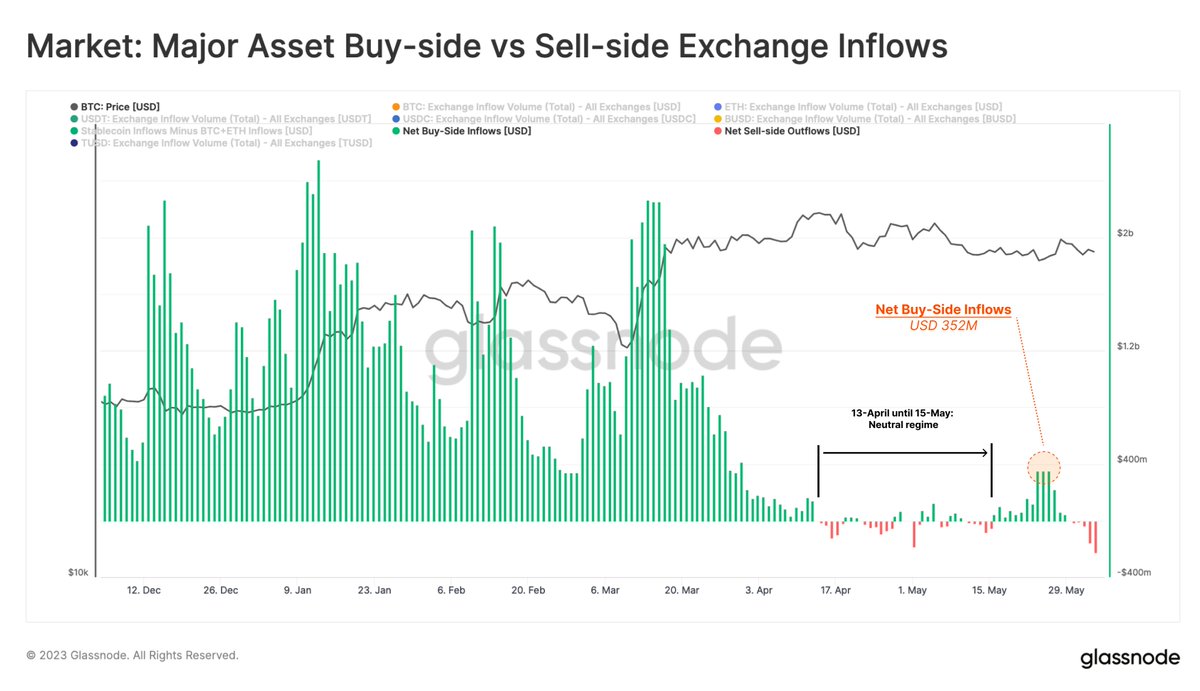
If we look at exchange on-chain flows, we also see considerably weaker demand since April.

Stablecoin inflows massively offset $BTC + $ETH inflows in Q1 🟩.

However we now see larger $BTC + $ETH inflows (assumed sell-side) relative to stablecoins🟥 as the market corrects lower Image
Several undercurrents are in play, suggesting a net capital rotation, and migration of liquidity towards lower risk digital assets.

We have a comprehensive dashboard available to help track these on-chain flows, and gauge sentiment and market preference👇
glassno.de/3WRzsTR ImageImageImageImage

• • •

Missing some Tweet in this thread? You can try to force a refresh
 

Keep Current with glassnode

glassnode Profile picture

Stay in touch and get notified when new unrolls are available from this author!

Read all threads

This Thread may be Removed Anytime!

PDF

Twitter may remove this content at anytime! Save it as PDF for later use!

Try unrolling a thread yourself!

how to unroll video
  1. Follow @ThreadReaderApp to mention us!

  2. From a Twitter thread mention us with a keyword "unroll"
@threadreaderapp unroll

Practice here first or read more on our help page!

More from @glassnode

Jun 6
Following the SECs 13 civil charges against the leading cryptocurrency Exchange Binance, the Exchange experienced a net outflow of -10.5K BTC, with only 11 trading days recording larger outflows.

However, the current value remains a significant -29.8K BTC (-74%) smaller than the… twitter.com/i/web/status/1… Image
When assessing the net outflow in USD terms, we note a value of -$277M, the 15th largest on record. Again, when comparing this to the peak net outflow of $1.04B, the current value remains -$763M (-73%) smaller. Image
Breaking down the Net Transfer Volume from/to Binance by USD Size, 51% of the of outflow volume was driven by withdrawals sized $1M-$10M.

🔴 More than $10M: -$26M (9.3%)
🟠 $1M to $10M: -$141M (51%)
🟡 $100K to $1M: -$70M (25.2%)
🟢 $10K to $100K: -$29M (10.5%)
🔵 Less than… twitter.com/i/web/status/1… Image
Read 4 tweets
May 19
The past week has witnessed a series of significant governance proposals 📜 and votes 🗳️ by major players within the DeFi space, including Lido, Maker and UniSwap.

What are the economic implications of these decisions and the future course for these protocols?

A thread🧵 twitter.com/i/web/status/1… Image
On May 15th, LidoDAO successfully passed a governance proposal, leading to the launch of Lido V2. This upgrade introduces stake withdrawals and a staking router, a modular infrastructure for validator pools.

Now, new nodes can be registered with Lido in a permissionless manner,… twitter.com/i/web/status/1… ImageImageImage
After successfully launching its new Lending Protocol Spark, DeFi’s second largest protocol, MakerDAO came up with a new proposal that would radically restructure its architecture.

In accordance with the Endgame roadmap announced last year, the proposal suggests splitting the… twitter.com/i/web/status/1… Image
Read 5 tweets
May 14
On May 11th and 12th, the #Ethereum network experienced two occasions where over 60% of the validators stopped performing their duties, causing a loss in Finality.

Finality refers to the state where a supermajority of validators (2/3 of the total stake) have attested to the… twitter.com/i/web/status/1… Image
With up to 60% of validators offline and absent in consensus responsibilities, the performance of the chain was degraded. About 3.68% of daily slots were missed and 253 blocks not proposed on time. This remains significantly lower than the 658 blocks missed across the Shapella… twitter.com/i/web/status/1… ImageImage
On a more technical level, some consensus layer clients encountered older attestations and were forced to load up older states for verification, whilst simultaneously trying to handle new incoming attestations, which eventually caused these systems to overheat and malfunction.… twitter.com/i/web/status/1… Image
Read 4 tweets
Apr 30
#Bitcoin daily transaction counts are approaching All-time-highs, seeing an explosive uptick in 2023.

With the emergence of Inscriptions, analysts now need to assess how much of this is driven by Inscriptions vs monetary transfers.

A quick 🧵 to explore
glassno.de/41PQYtj Image
We start with our #Bitcoin mempool, where we see a marked character shift this year.

The sharp fee pressure spike during FTX stands out, as does the sustained fee pressure in 2023.

These plateaus are aligned with three waves of Inscriptions, as people rushed to get in under 1M Image
We can see a shift in preference as it relates to inscription types.

Image Inscriptions 🟧 dominated until very recently, but have been surpassed by text based 🟦.

Over 2.39M Inscriptions have been added to the #Bitcoin ledger, adding 9.3GB in data, and paying 212 $BTC in fees. ImageImageImageImage
Read 8 tweets
Apr 29
#Bitcoin block 787,500 will be mined shortly, which means we're ~1yr from the next halving event

We have also released a new dashboard exploring the tremendous growth of #Bitcoin over each halving epoch

📊 glassno.de/3oIIpSc

A quick 🧵covering BTC growth by halving cycle. ImageImageImageImage
The extraordinary trajectory of #Bitcoin requires a log scale to visualize properly

Each of the following charts are indexed to 100 on the halving, to display performance over each halving epoch

$BTC Market Cap growth remains explosive
1️⃣: 470x
2️⃣: 80x
3️⃣: 16x
4️⃣: 2.5x (so far) Image
The #Bitcoin Realized Cap is the on-chain equivalent to the Market Cap, pricing each coin when it last transacted on-chain.

This shows the true value of coins active in the #Bitcoin economy

The $BTC Realized Cap has similarly increased
1️⃣: 424x
2️⃣: 75x
3️⃣: 17x
4️⃣: 2.7x (so far) Image
Read 8 tweets
Mar 15
The topic of #Bitcoin supply concentration is a favourite for critics of the asset.

In our latest research piece, we explore how the smallest HODLers of $BTC, the Shrimp (< 1 $BTC) 🦐 and Crab (< 10 $BTC)🦀 are in fact last cycles largest accumulators.

insights.glassnode.com/bitcoin-supply…
We revisit our prior research, and compare the change in #Bitcoin wallets over the course of the 2021-23 cycle.

What we find is that small entities, with < 50 $BTC have absorbed the largest volume of coins, sourced from Whales, Miners and Exchanges.

insights.glassnode.com/bitcoin-supply… Image
We introduce a new metric called Yearly Absorption Rate, which shows the proportion of new $BTC issuance absorbed by each wallet size cohort.

What we generally find is that Whales and Exchanges have fewer coins, whilst Shrimp, Crab, Fish and Shark cohorts (< 1k $BTC) are growing ImageImageImageImage
Read 5 tweets

Did Thread Reader help you today?

Support us! We are indie developers!


This site is made by just two indie developers on a laptop doing marketing, support and development! Read more about the story.

Become a Premium Member ($3/month or $30/year) and get exclusive features!

Become Premium

Don't want to be a Premium member but still want to support us?

Make a small donation by buying us coffee ($5) or help with server cost ($10)

Donate via Paypal

Or Donate anonymously using crypto!

Ethereum

0xfe58350B80634f60Fa6Dc149a72b4DFbc17D341E copy

Bitcoin

3ATGMxNzCUFzxpMCHL5sWSt4DVtS8UqXpi copy

Thank you for your support!

Follow Us on Twitter!

:(