Karen Braun Profile picture
Jun 6 5 tweets 3 min read Twitter logo Read on Twitter
🌽It's hard to tell 2023 (so far) apart from 2012 or 2013 on a new-crop #corn chart. Nearly identical.
But 2012 and 2013 are about to break up in a BIG way, and U.S. weather was the catalyst. Where 2023 heads depends on (much needed) Midwest rains in the coming weeks. Image
Look at the 6-10 and 8-14 day U.S. weather outlooks from June 5, 2012 & 2023. Prices softened into June 2012 because weather outlooks weren't disastrous (yet). I'm not saying AT ALL (seriously) that 2012 is our eventual outcome, but I highly value reviews of past thinking. ImageImage
Can't leave out fund positioning when comparing years. They weren't bearish #corn in 2013 until July, but they weren't too bullish in June 2012 or 2013. Bit of a different story now, but funds covered shorts at the end of May, potentially carrying through early June? Image
Lowdown on USDA WASDE June 2012:
▪️#Corn yield (simple linear long-term trend; 166 bu/acre) was unchanged from May
▪️12/13 stocks/use projected at 13.7% versus sub 7% in 11/12 (unch from May) Image
If you're immersed into the 2012 analysis, remember that the current model USDA uses for its corn yield was employed in 2013. Therefore the lack of yield adjustments in June 2012 may or may not be relevant today. See pages 10-14 for more: ers.usda.gov/webdocs/outloo…

• • •

Missing some Tweet in this thread? You can try to force a refresh
 

Keep Current with Karen Braun

Karen Braun Profile picture

Stay in touch and get notified when new unrolls are available from this author!

Read all threads

This Thread may be Removed Anytime!

PDF

Twitter may remove this content at anytime! Save it as PDF for later use!

Try unrolling a thread yourself!

how to unroll video
  1. Follow @ThreadReaderApp to mention us!

  2. From a Twitter thread mention us with a keyword "unroll"
@threadreaderapp unroll

Practice here first or read more on our help page!

More from @kannbwx

Sep 12, 2022
Harvested area for U.S. #soybeans fell toward the low end of the trade range. The overall 580k drop was driven by mid-south & eastern states, along with a 900k acre combined reduction across IL-IA-SD. Planted acres = 87.5M (was 88 in Aug).
Trade's been wanting higher soy acres since the low side shocker in June. IMO, we might be placing too much emphasis on FSA data or are drawing incorrect conclusions from it. The way the data is collected has changed in recent years, so "completeness" analyses prob aren't useful.
In analysts' defense, here's their planting guesses for #soybeans vs USDA actual this year:
March poll: 88.7M
March 31 actual: 91M
June poll: 90.4M
June 30 actual: 88.3M
Sept actual: 87.5M
That March survey REALLY threw the ideas off for much of this year...
Read 4 tweets
Jul 26, 2022
🇺🇸A brief history of U.S. #corn yield growth since the 1860s 🌽 Notable growth in yields was seen after the adoption of modern fertilizers in the 1940s, which made drought years esp. in the 1980s stand out more than before (compare with 1930s Dust Bowl for example).
I didn't include all possible difference makers on the chart, just the top ones, but there are probably other things I could include. Anyone have suggestions?

This shows just how bad the 1988 & 2012 droughts were (you can also see 1983, 1993, etc in there).
The first chart makes trend yield look like it's just up up up. But let's zoom in. Look at the last several years. What's really the trend? To me, 181 for 2022 seemed too high (USDA's original "unofficial" before planting delays). Input greatly welcome here, it's been on my mind.
Read 4 tweets
May 31, 2022
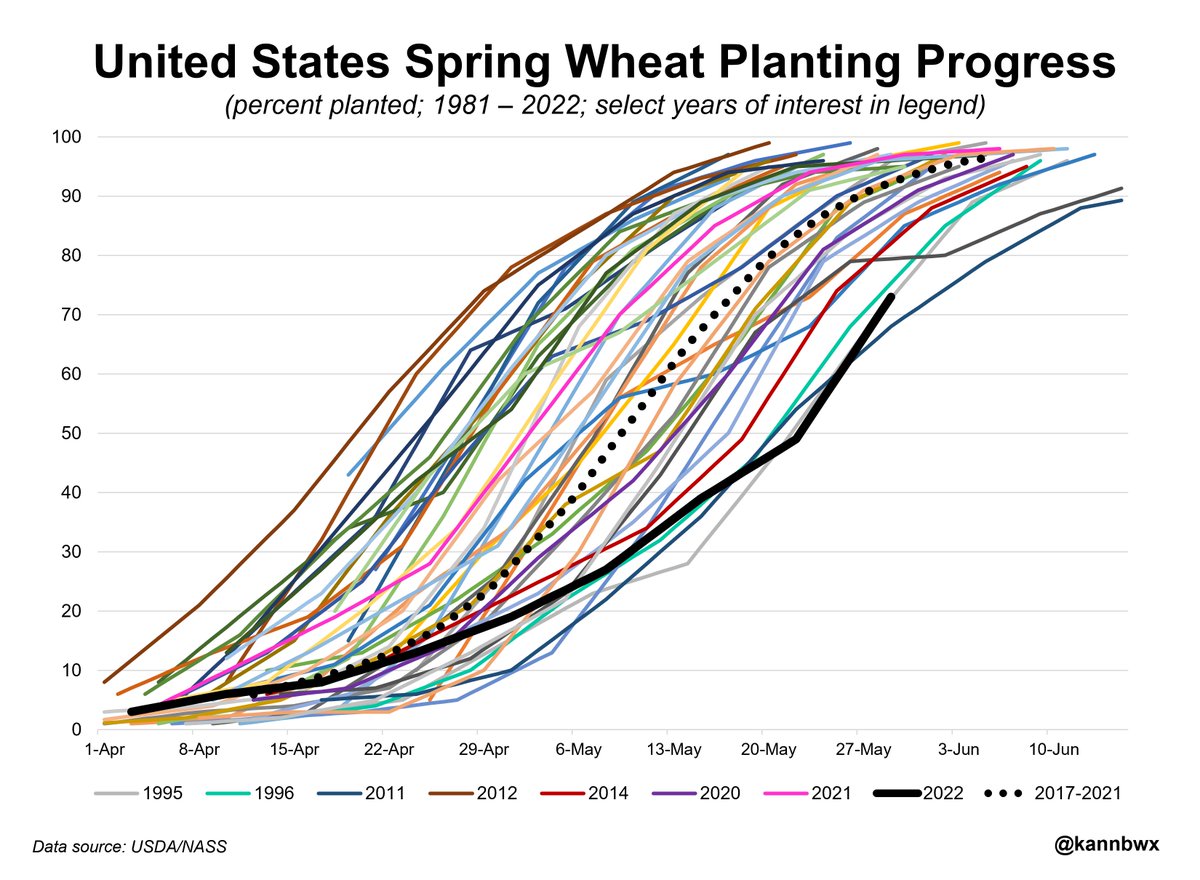
U.S. spring #wheat planting was near record slow as of Sunday at 73% complete, as wet weather has delayed top growers North Dakota & Minnesota. Spring wheat accounts for 32% of the full U.S. wheat crop, and last year's spring harvest was the smallest since 1988 due to drought.
North Dakota grows about half of the U.S. spring #wheat, but Minnesota, accounting for 14% of production, is planting at the slowest pace ever. Almost no wheat got planted in the state until last week. Still, it is uncertain just how many of MN's intended acres will get planted.
Only 29% of U.S. winter #wheat was in good/excellent health as of Sunday, the lowest for the week since 2006. Other years with similarly low ratings had terrible yields. However, the winter wheat problems have been known for some time now. Wasn't much room for spring crop errors.
Read 4 tweets
May 31, 2022
North Dakota is planting #corn & #soybeans at a record slow pace, corn by a comfortable margin. Only 56% of ND's corn was planted by May 29, and May 25 was the last day for most ND farmers to plant 🌽 and be fully eligible for elected crop insurance. ND grows 3% of U.S. corn. Image
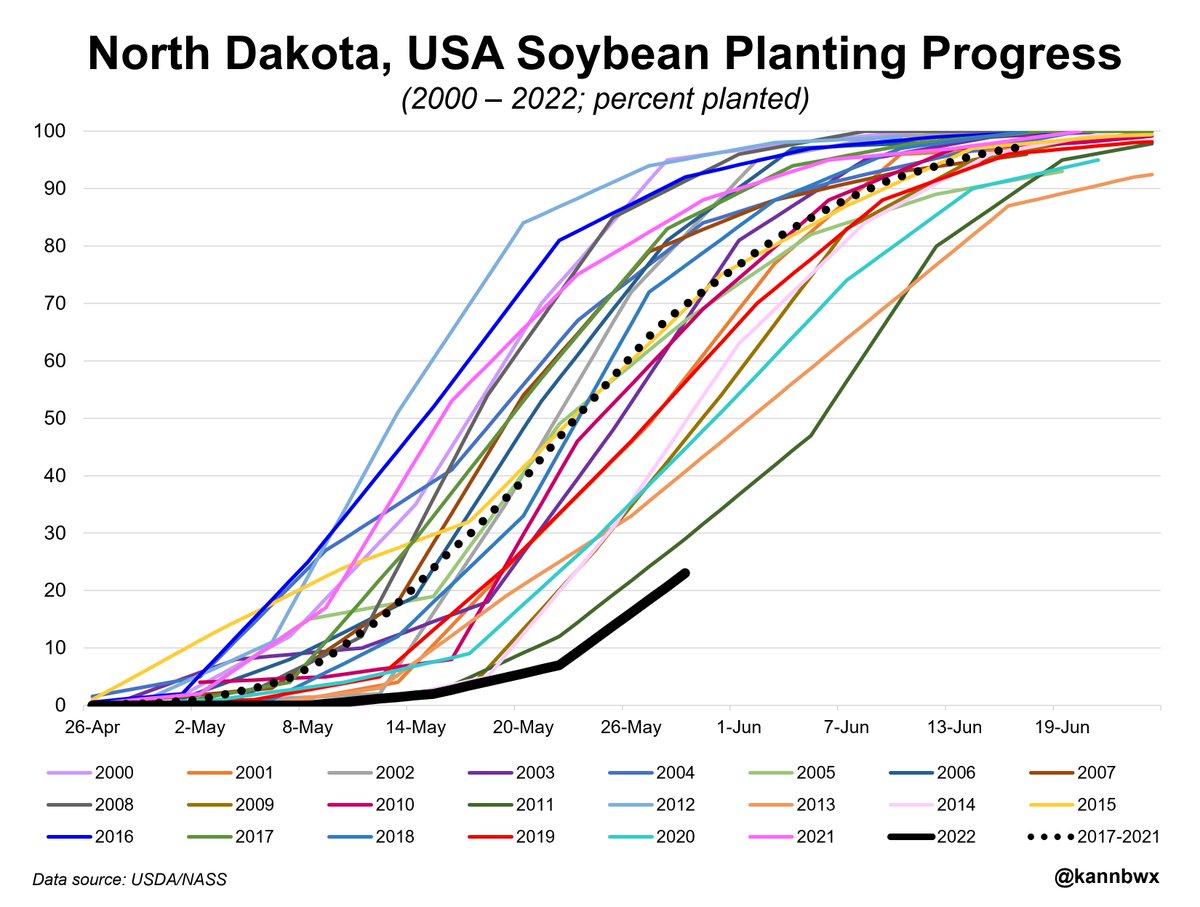
North Dakota grows 5% of U.S. #soybeans, a large portion of which get exported to China. Only 23% of ND's beans were planted by May 29 vs 86% last year. Final crop insurance planting date is June 10, but to complete planting, ND cannot have any more rainy episodes from here. Image
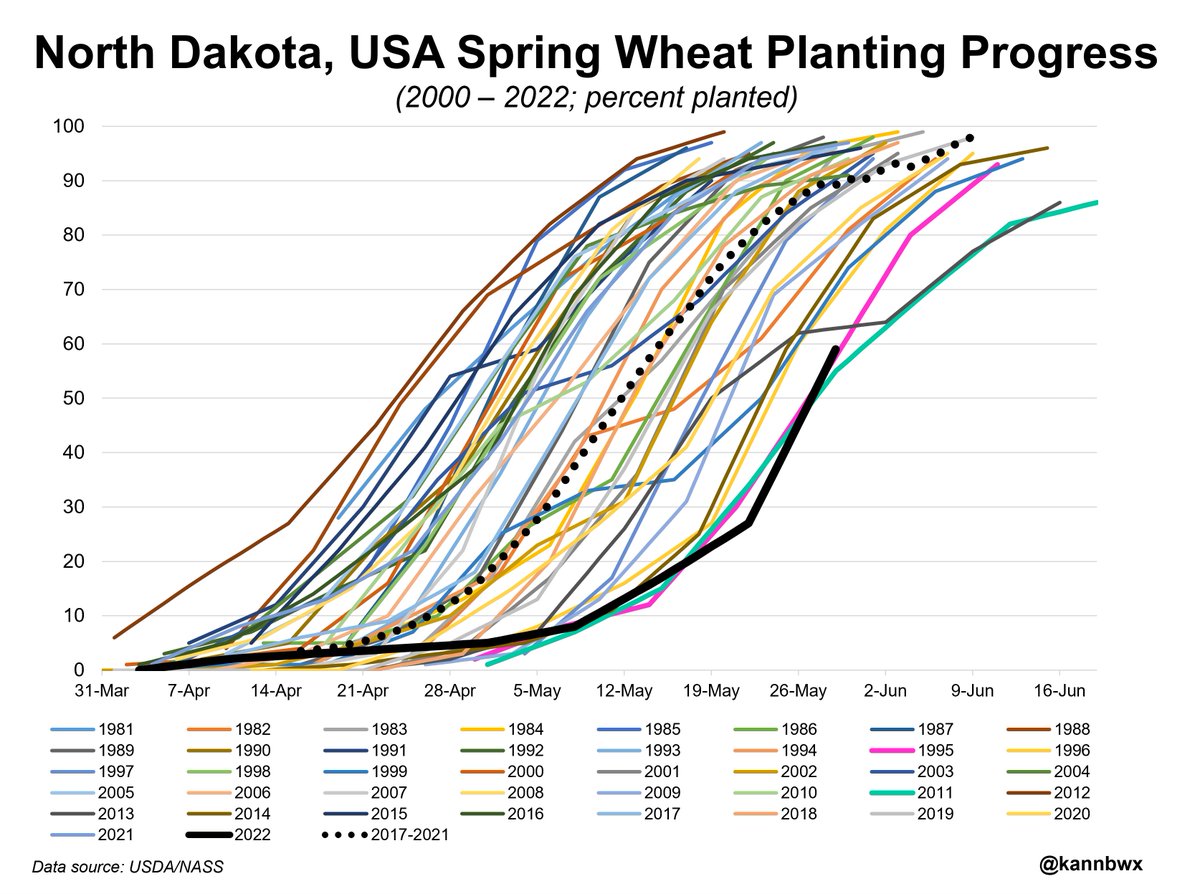
North Dakota's spring #wheat planting is no longer slowest ever (but it's close) at 59% complete by May 29. Final planting date is either May 31 or June 5, but 91% of ND's wheat should be planted by now. ND grows half of the country's protein-rich spring wheat. Image
Read 7 tweets
May 26, 2022
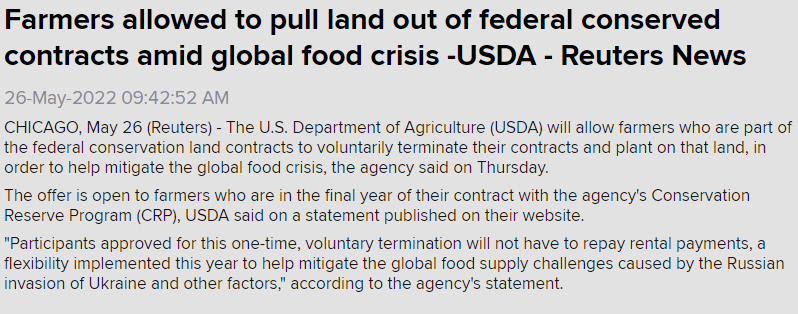
USDA will allow U.S. farmers to plant on acres currently parts of the federal conservation program with no penalty in order to ease global food supply worries. The offer is open to farmers in the final year of their contract with USDA's CRP program.
I've discussed this before on here. Given that June is in less than a week, I believe farmers would have needed significantly more notice in order to make anything happen this year. Don't forget, planting crops is incredibly expensive this year.
Just one year ago (when grain prices were already at multi-year spring highs), USDA was attempting to add more acres to CRP in both the short and long term for climate mitigation purposes. That announcement is here:
fsa.usda.gov/news-room/news…
Read 4 tweets
May 24, 2022
May 24: Most-active CBOT #corn futures settled below the 50-day moving average for the first time since Oct. 21, 2021. The settle of $7.71-3/4 per bushel is 6.4% off the April 29 high of $8.24-1/2. 100-day avg as of Tuesday is about $7.14. Image
A longer term picture. Closing below the 50-day avg is generally a negative technical sign, but it isn't guaranteed. Corn settled below the 50-day on March 30, 2021 for the 1st time since Aug. 12, 2020, then didn't do it again til June. Though now, corn is near historic highs. Image
U.S. planting progress and China/Brazil trade prospects weighed down the corn market Tuesday. U.S. corn planting is still historically slow, but not 2019, no-end-in-sight slow. China cleared Brazilian corn for import, causing concerns for US competitiveness into China.
Read 4 tweets

Did Thread Reader help you today?

Support us! We are indie developers!


This site is made by just two indie developers on a laptop doing marketing, support and development! Read more about the story.

Become a Premium Member ($3/month or $30/year) and get exclusive features!

Become Premium

Don't want to be a Premium member but still want to support us?

Make a small donation by buying us coffee ($5) or help with server cost ($10)

Donate via Paypal

Or Donate anonymously using crypto!

Ethereum

0xfe58350B80634f60Fa6Dc149a72b4DFbc17D341E copy

Bitcoin

3ATGMxNzCUFzxpMCHL5sWSt4DVtS8UqXpi copy

Thank you for your support!

Follow Us on Twitter!

:(