
Chief Market Analyst @ Zaner Ag Hedge
Access my Newsletter ➡️ linked below
Ex Reuters Ag Columnist
Meteorologist by training, gymnast for life
Views are my own
 Look at the 6-10 and 8-14 day U.S. weather outlooks from June 5, 2012 & 2023. Prices softened into June 2012 because weather outlooks weren't disastrous (yet). I'm not saying AT ALL (seriously) that 2012 is our eventual outcome, but I highly value reviews of past thinking.

 Trade's been wanting higher soy acres since the low side shocker in June. IMO, we might be placing too much emphasis on FSA data or are drawing incorrect conclusions from it. The way the data is collected has changed in recent years, so "completeness" analyses prob aren't useful.
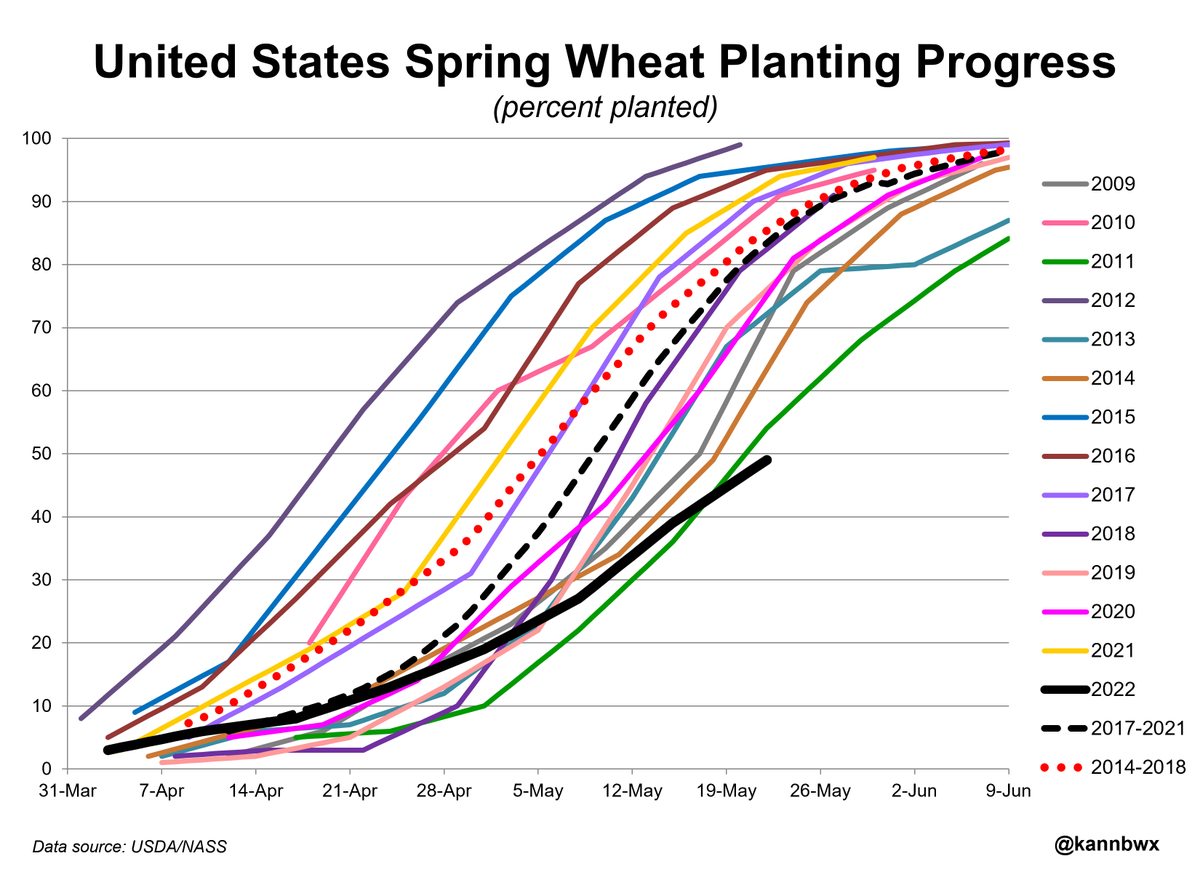
 I didn't include all possible difference makers on the chart, just the top ones, but there are probably other things I could include. Anyone have suggestions?
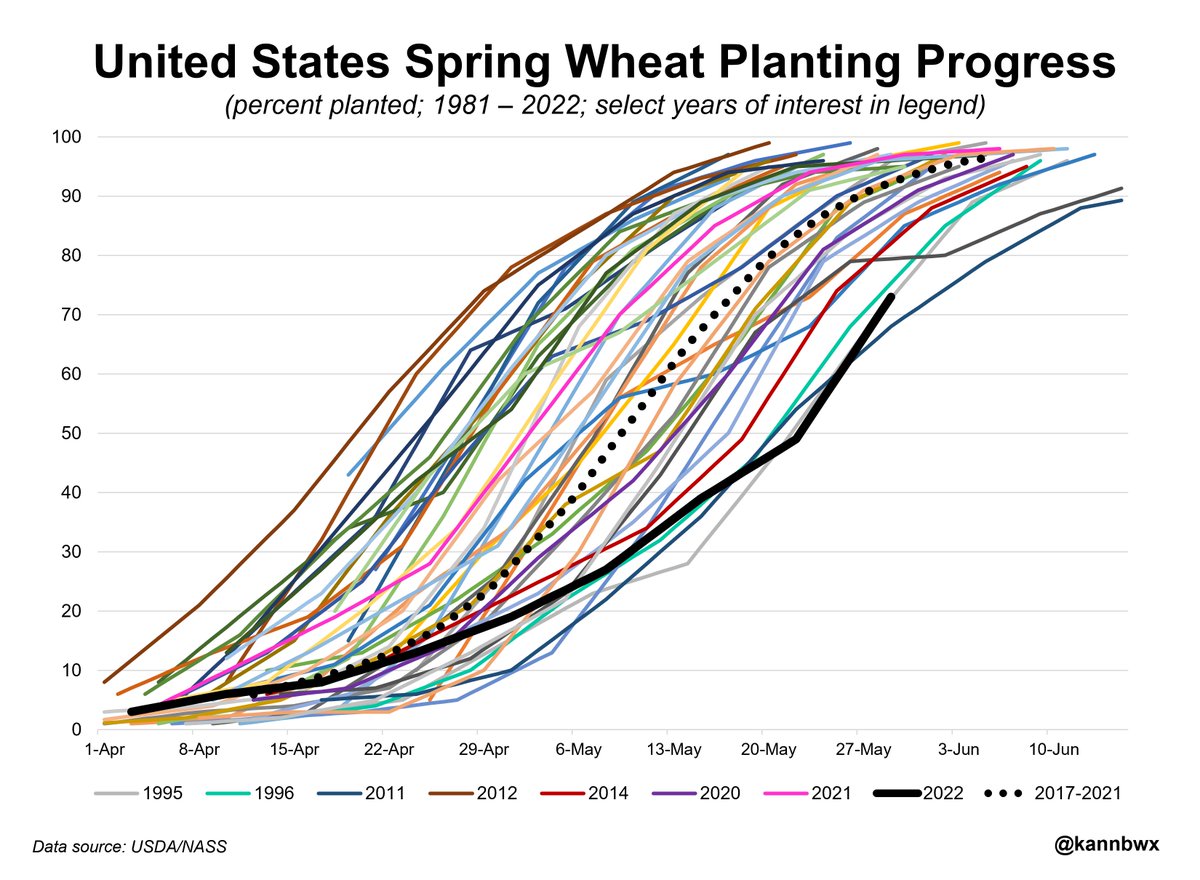 North Dakota grows about half of the U.S. spring #wheat, but Minnesota, accounting for 14% of production, is planting at the slowest pace ever. Almost no wheat got planted in the state until last week. Still, it is uncertain just how many of MN's intended acres will get planted.
 North Dakota grows 5% of U.S. #soybeans, a large portion of which get exported to China. Only 23% of ND's beans were planted by May 29 vs 86% last year. Final crop insurance planting date is June 10, but to complete planting, ND cannot have any more rainy episodes from here.
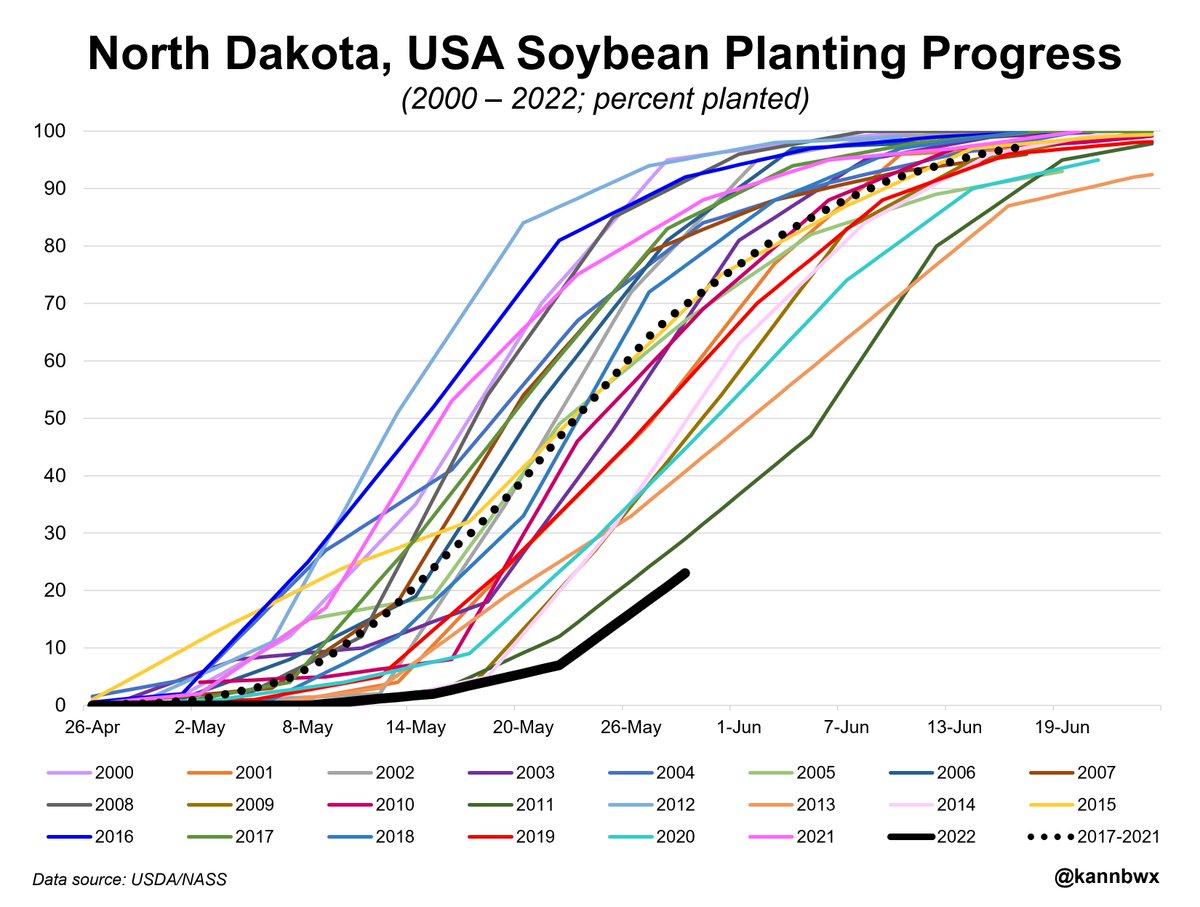
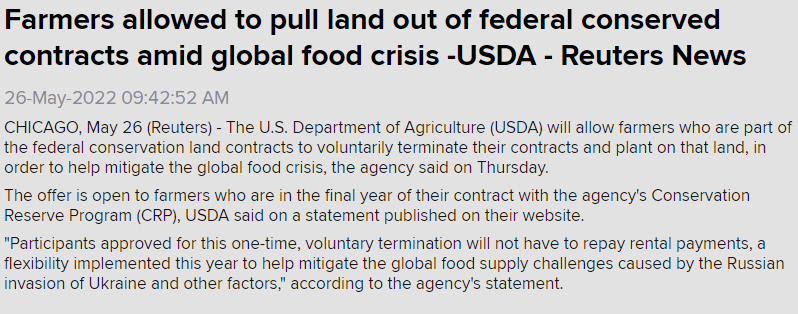 I've discussed this before on here. Given that June is in less than a week, I believe farmers would have needed significantly more notice in order to make anything happen this year. Don't forget, planting crops is incredibly expensive this year.
 A longer term picture. Closing below the 50-day avg is generally a negative technical sign, but it isn't guaranteed. Corn settled below the 50-day on March 30, 2021 for the 1st time since Aug. 12, 2020, then didn't do it again til June. Though now, corn is near historic highs.
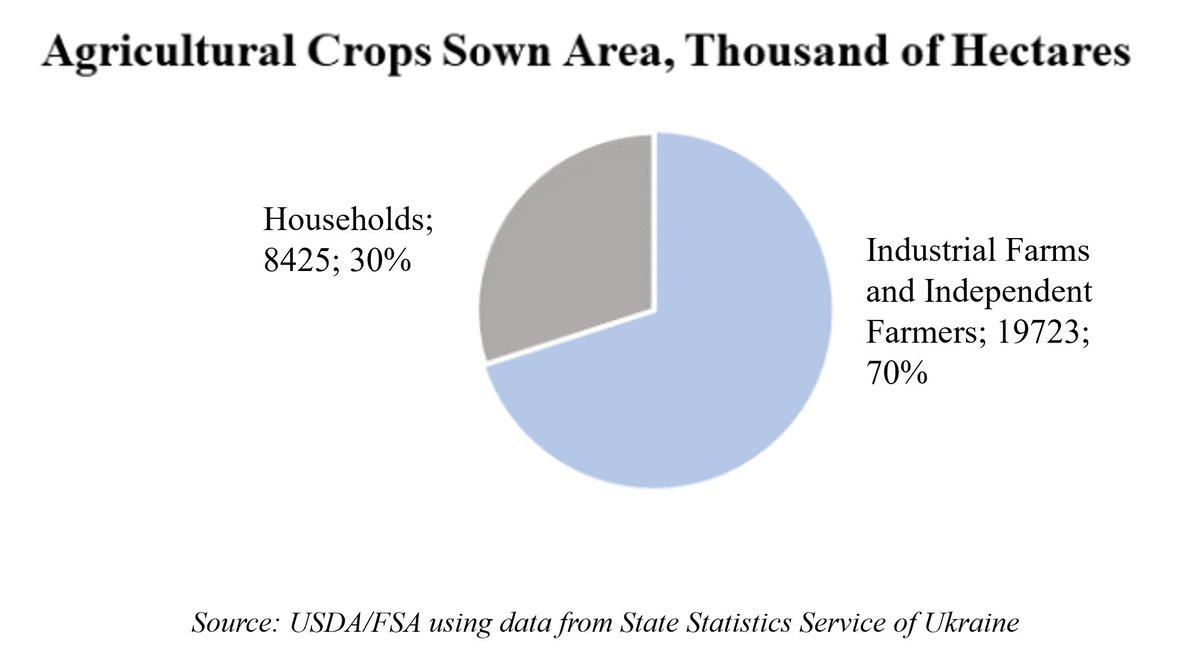 We missed Grain & Feed/Oilseeds annual reports, incl. 2022/23 projections. USDA hasn't necessarily said its Kyiv attache is not operating, but info remains thin. Report says #Ukraine's State Statistics Service has officially stopped publishing all new data until the war is over.
 Those original 7 countries I showed account for 2/3 of #Brazil's annual #corn shipments. Taiwan also overlaps with USA, as does Mexico when adding some secondary Brazilian buyers.
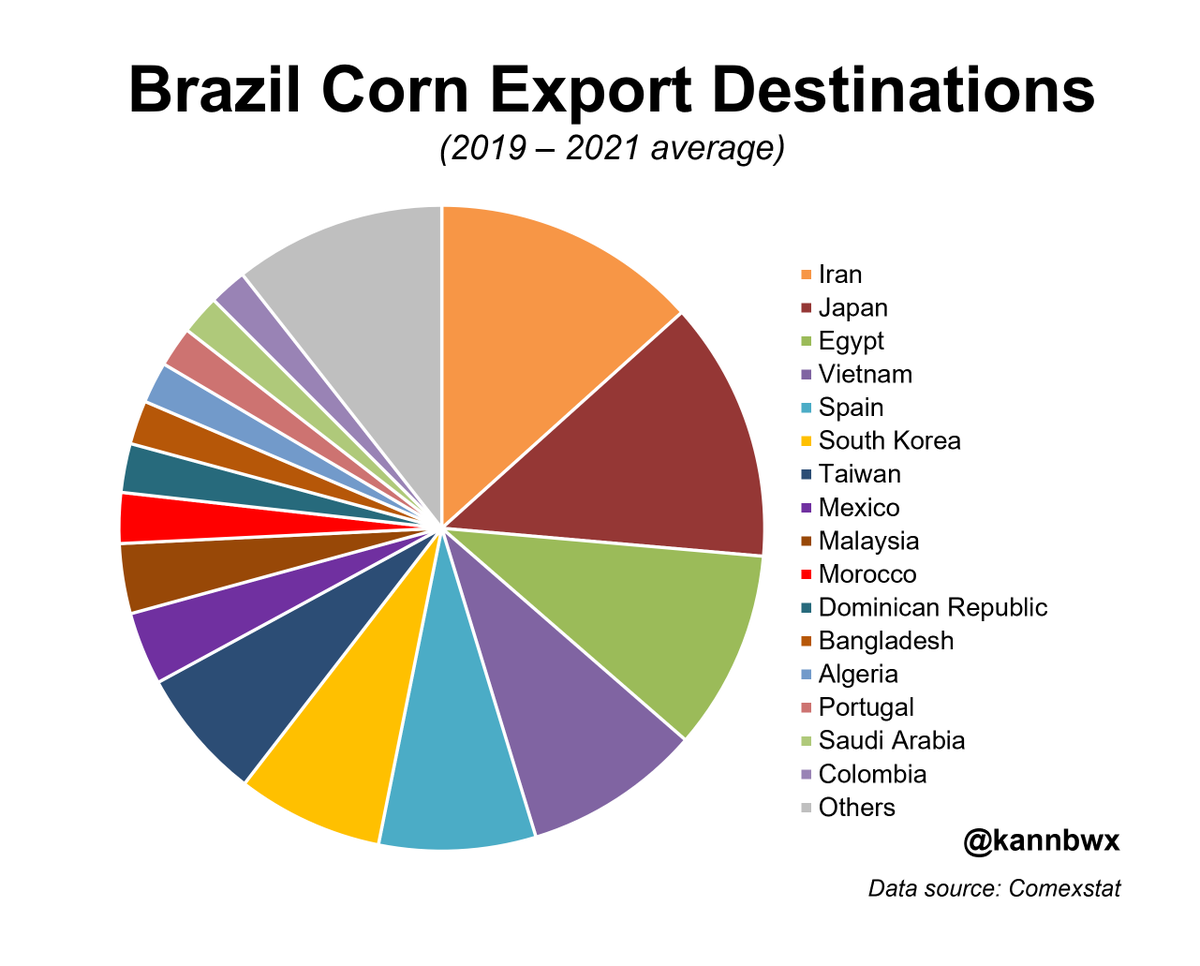
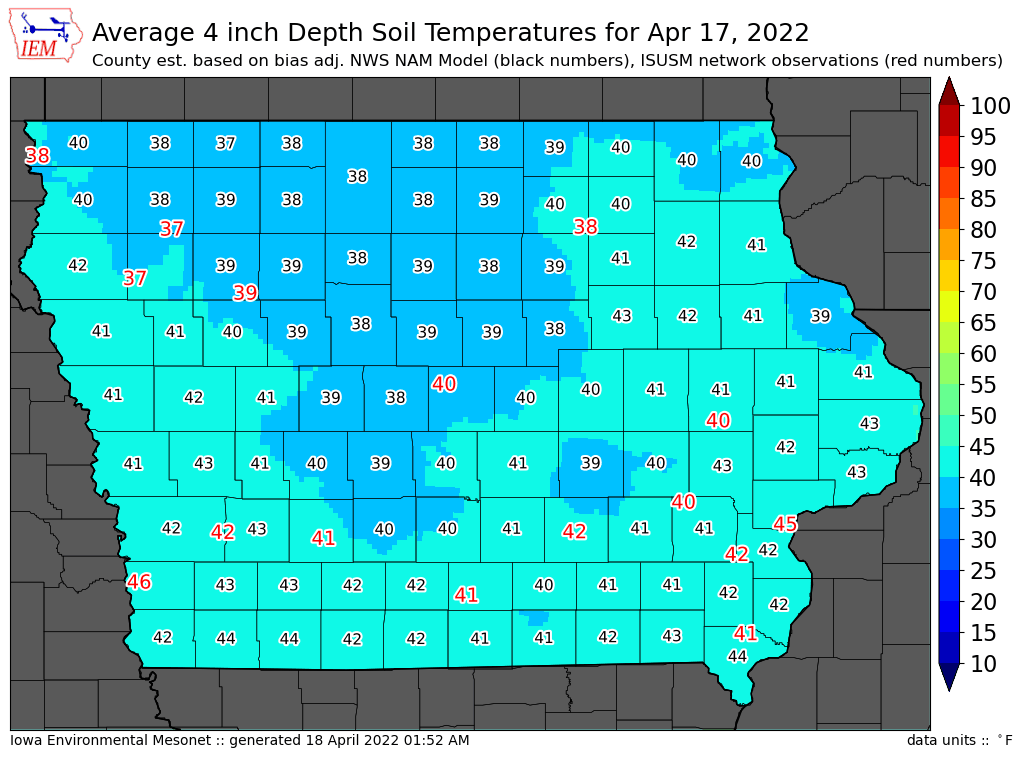
 Just a reminder, this has to do with extremely wet spring weather in much of the Northern Plains. That area faced a bad drought last year, but too much rain in April and some rains/cool weather since then has kept farmers and their heavy equipment out of fields.
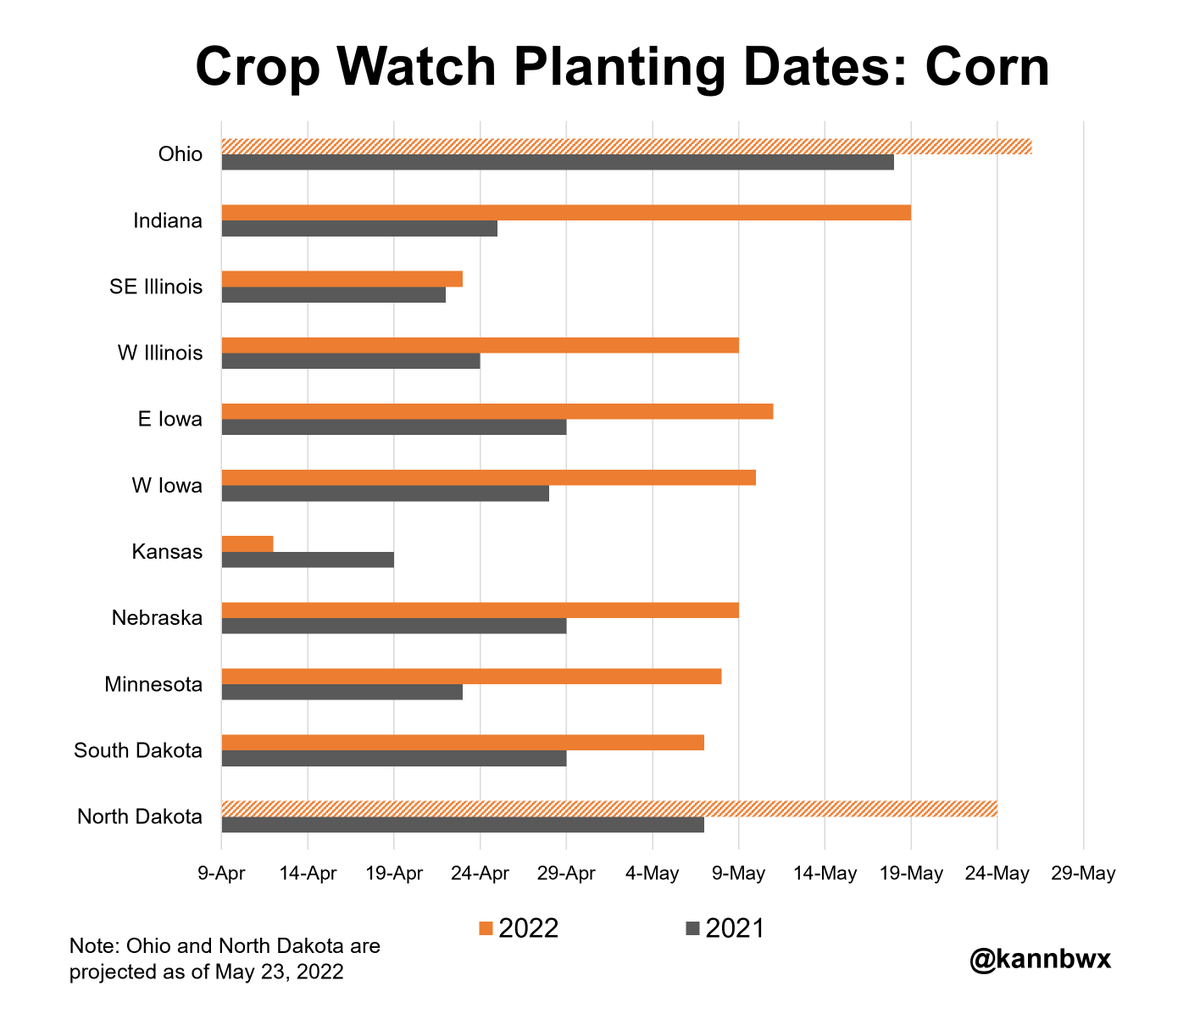 #CropWatch22 added #soybeans in South Dakota, W Iowa and Ohio last week. Just North Dakota remains, and the potential timing is totally unknown yet. Things are day by day in ND right now, and the focus is on corn. W Illinois is the only bean field planted earlier than in 2021.
 It was a decent night to plant #corn in Minnesota Saturday night, though rain was forecast Sunday, so the #CropWatch22 corn was finished 4:30 am Sunday morning. The South Dakota corn also went late into the night Sat-Sun, finishing at 2 am. Needing to beat some weather.
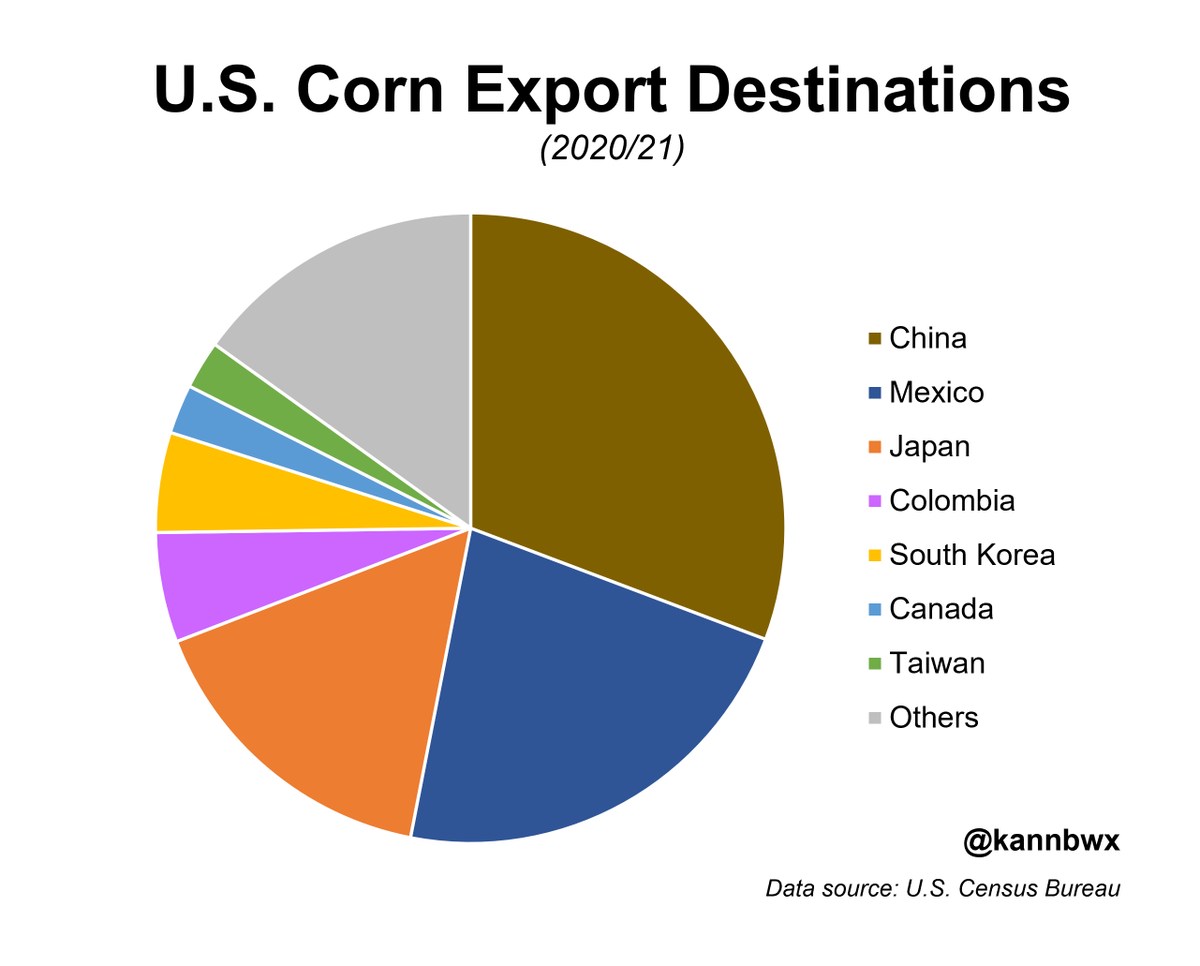 🇺🇸USA only started shipping heavily to #China again in the last two years, so here is the 3-year average prior to that. Mexico, Japan & South Korea accounted for 58%.
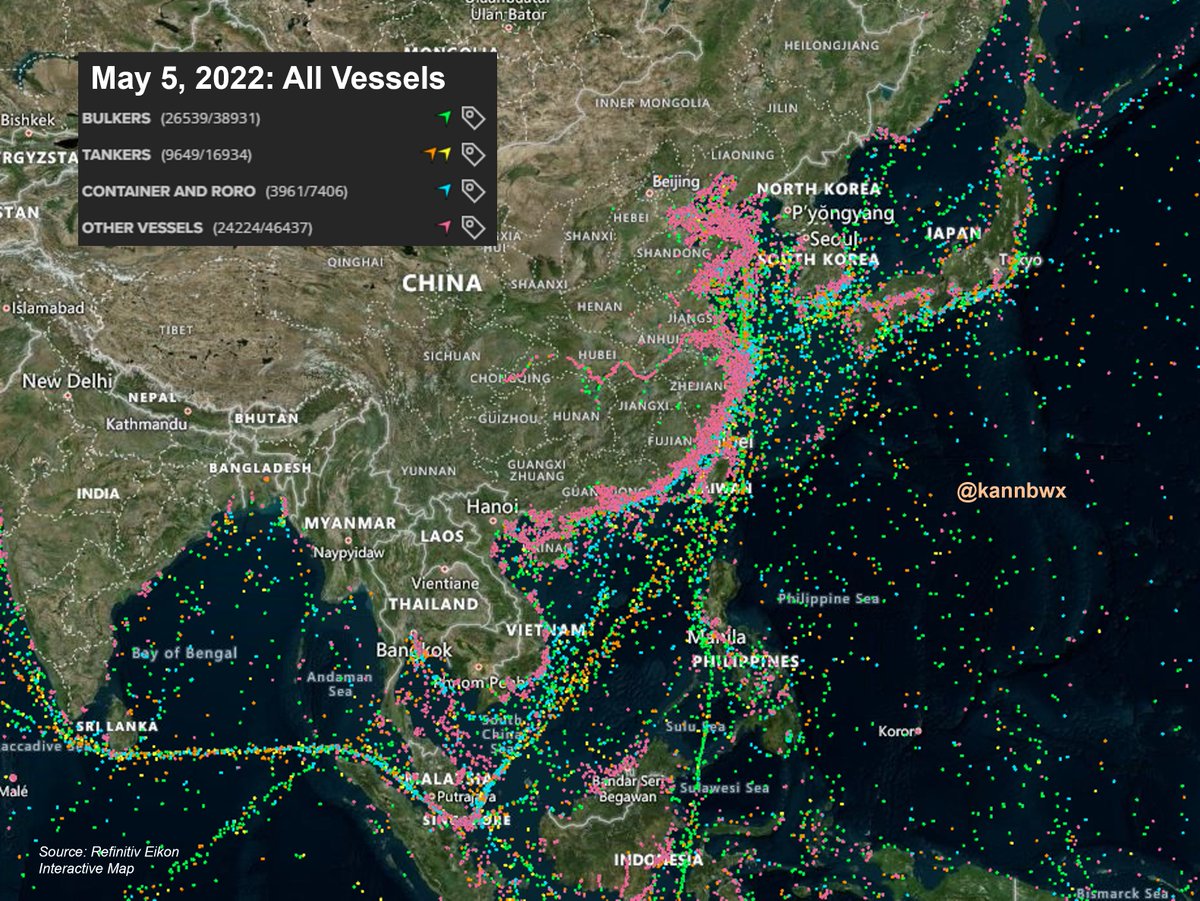 Here's a look at Shanghai. Zooming in on that one clump of vessels shows they are mostly stationary (at anchor) waiting for their turn. Shipping something from a warehouse in #China to one in the USA now takes 74 days longer than usual.
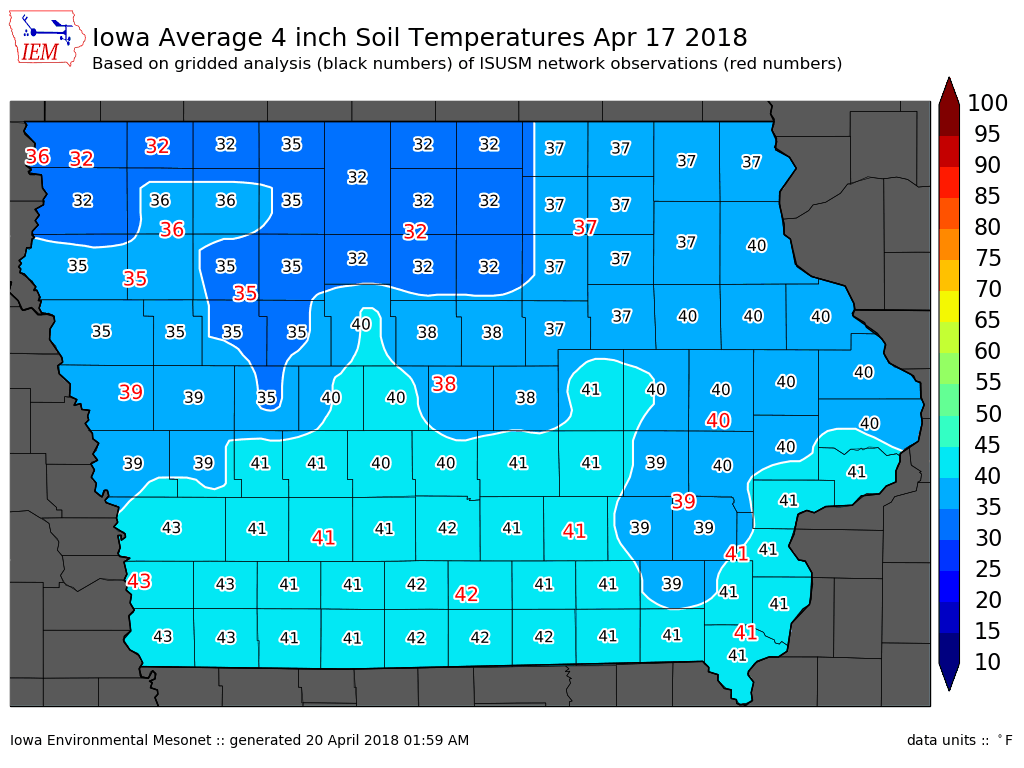
 Here's the same week in the previous four years just for fun. The core Corn Belt states have not often started spring planting in widespread drought conditions. The HRW wheat crop in the S. Plains was heavily affected by drought in 2015 and 2018.
 Here's going back 4 years on the same date:


 Global #wheat stocks-to-use in 2021/22 of 28.5% would be a six-year low. Excluding #China, that ratio falls to 16.6%, a 14-year low.
 Don't be fooled by +22% YOY for #soybeans when it comes to Sept. 1 possibilities. 2nd half use in 20/21 was a 6yr low and 18% below the 5yr avg. Exports were extremely light for the period after the big effort in H1, and the remaining 21/22 book is much bigger than usual.
 But I asked farmers yesterday to give insight on why acres were light and got a BUNCH of good answers (thank you!). Some of those explanations (high cost of inputs, prices of other crops - hay for example, rotations, etc) all make sense. Check out that thread if you haven't.
 Versus what was reported in January, December 1 stocks came in:
 And if you consider Ag & Related Products (includes fish & forestry products) - max was $29 billion in 2013. So this is the absolute max previous ceiling considering all exports that could be considered ag.