Justin Lessler Profile picture
Justin Lessler is a Professor of Epidemiology at the UNC Gillings School of Global Public Health
Rulito Profile picture Ricardo Losno Montenegro Profile picture 2 subscribed
Jun 1, 2022 14 tweets 6 min read
In yesterday's @nytimes @DLeonhardt explores an apparent contradiction, saying masks work against #COVID19 but mask mandates do not. The premise of this article is wrong. The evidence is clear that mask mandates work. Let's take a look (1/14)
nytimes.com/2022/05/31/bri… Starting with my work I was involved in, we found a significant association between mask mandates in schools and household members reporting #COVID19 related outcomes. (2/14)
doi.org/10.1126/scienc…
doi.org/10.1126/sciadv…
Jan 21, 2022 7 tweets 5 min read
Round 12 of the #COVID19 Scenario Modeling Hub is an update our #omicron scenarios taken into account our better understanding of this variant. (1/7)
covid19scenariomodelinghub.org The big question on everyone's mind is "when will the omicron wave peak". Across scenarios, the average projected peak time across models is this week or the next. Several states are projected to have later peaks, none later than mid-February. (2/7)
Sep 22, 2021 4 tweets 3 min read
There has been questions as to why the #COVID19 Scenario Modeling Hub () doesn't show a winter surge despite seasonality.

First, this often seen in seasonal viruses when there is a big fall wave. See 2009 pandemic (figs doi 10.1086/524065 and TX DOH)(1/4) Even in 1918 larger early season epidemics were either not followed by clear resurgences, or follow-on winter waves were much smaller than the fall (2/4):
(from wwwnc.cdc.gov/eid/article/12… and academic.oup.com/jid/article/19… )
Sep 22, 2021 4 tweets 4 min read
The latest from the #COVID19 Scenario Modeling Hub out at covid19scenariomodelinghub.org
Scenario projections from multiple teams suggest the US will see decreasing cases through March. Vax of 5-11yos accelerates this trend and increase resilience. As always, there is nuance...(1/4) However, there is a lot of differences between states and und uncertainty overall. Though cases are expected to fall quickly in the states that have seen the largest Delta waves (LA, FL, etc.), but could continue to increase in the states that are yet to be hit hard... (2/4)
Apr 29, 2021 8 tweets 6 min read
Thrilled our paper on household #COVID19 risk and in person schooling is out in @ScienceMagazine rapid release!
science.sciencemag.org/content/early/…

w/ MK Grabowski, @andrewazman, @khgrantz, @Lizstuartdc, @CJEMetcalf et al.

Some highlights (repetatuve w/ ) (1/n) We use data from
@CmuDelphi
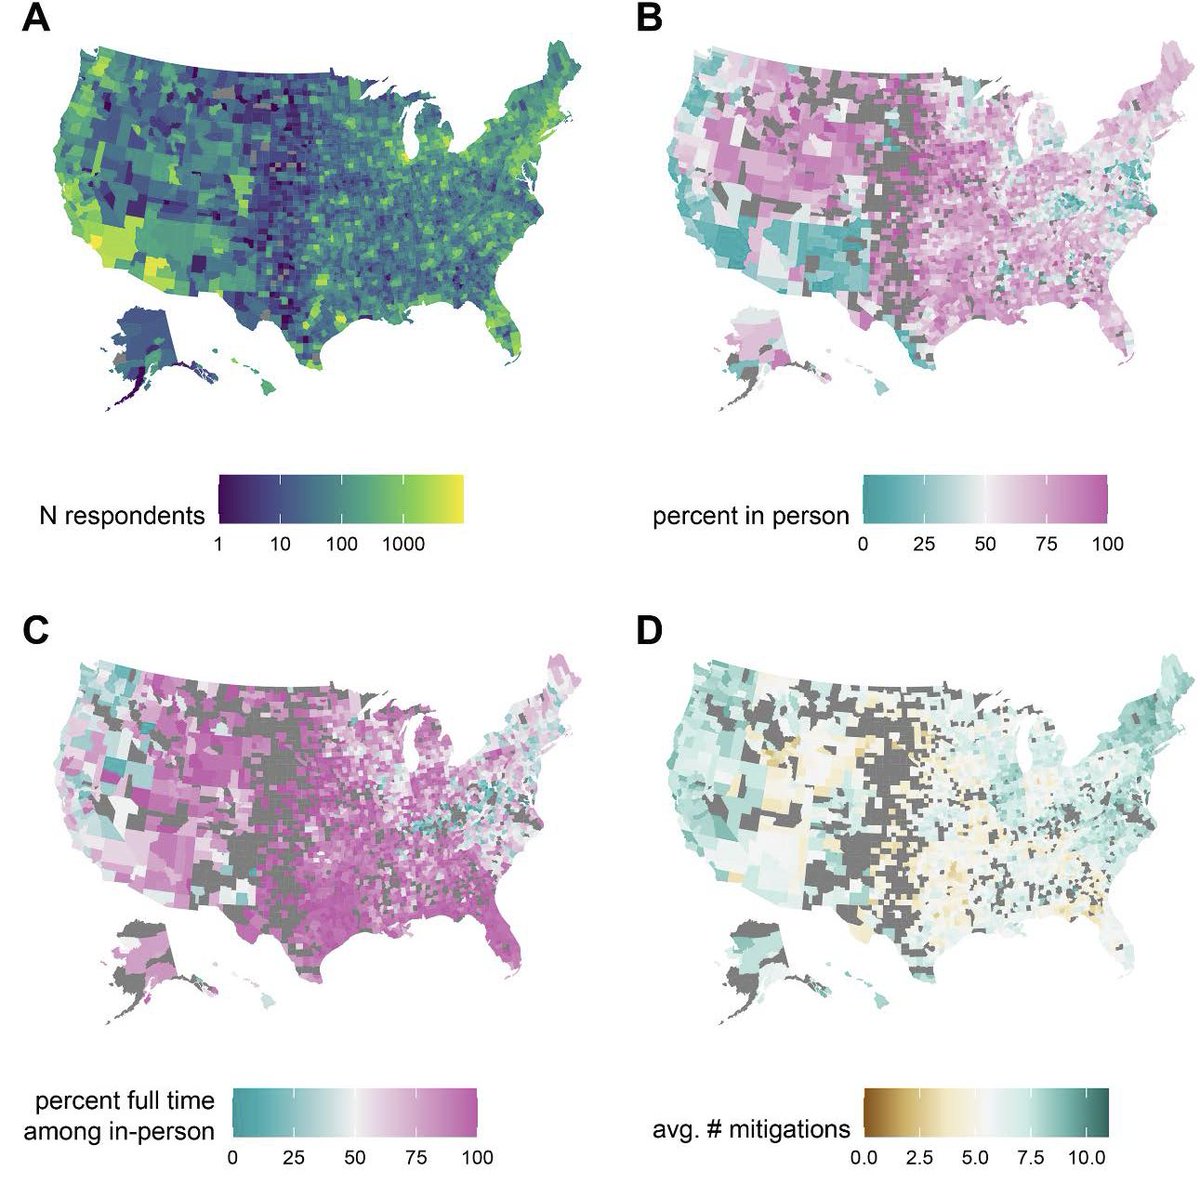
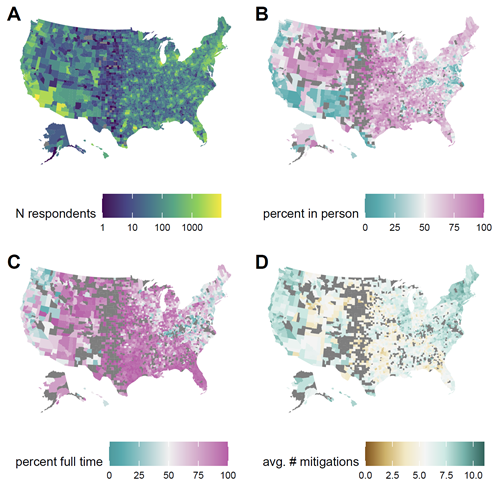
COVID-19 Symptom Survey delphi.cmu.edu/covidcast/surv…. Based on responses throughout the country (A) we see huge differences frequency of in-person schooling (B), the amount full time (C) and the number of mitigation measures reported (D) (2/8)
Mar 1, 2021 8 tweets 6 min read
In preprint w/ @KateGrabowski @khgrantz @andrewazman @CJEMetcalf @Lizstuartdc we look at #COVID-19 risk to household members from in-person schooling. A summary follows. Caution: this work has not yet been peer reviewed (1/8)
medrxiv.org/content/10.110… This work uses data from @CmuDelphi COVID-19 Symptom Survey delphi.cmu.edu/covidcast/surv…. Based on responses throughout the country (A) we see huge differences frequency of in-person schooling (B), the amount full time (C) and the number of mitigation measures reported (D) (2/8)
Nov 19, 2020 5 tweets 3 min read
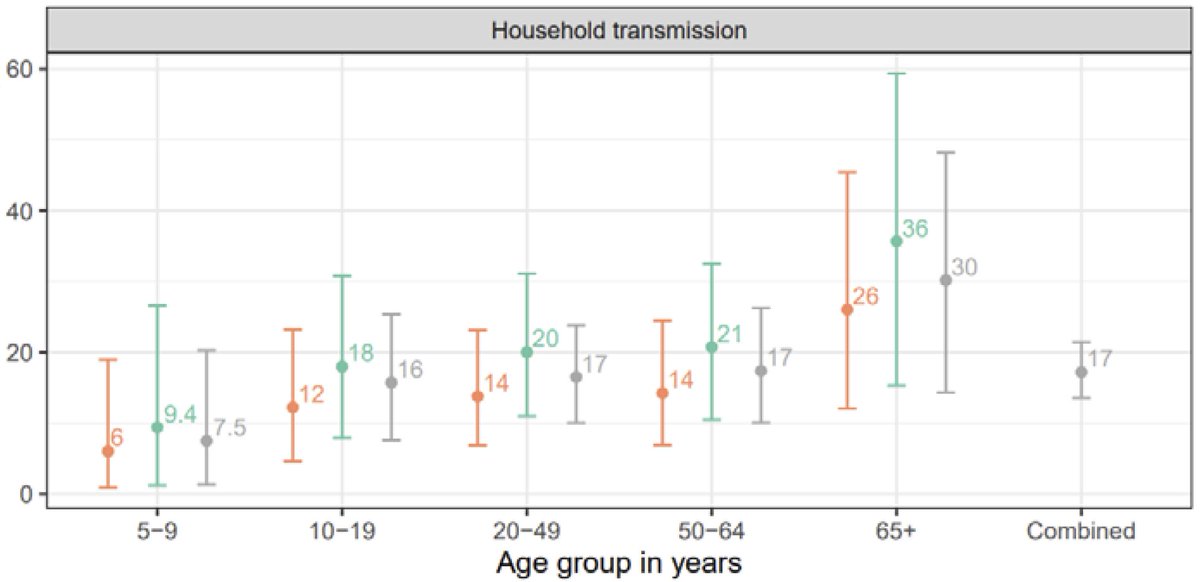
Our recent preprint in @medrxivpreprint with @QifangB @andrewazman @datcummings and others uses serological data to show how #SARSCoV2 entered and transmitted within homes in Geneva, Switzerland. Here are a few of the main findings. doi.org/10.1101/2020.1… (1/5) The chance of being infected by an infected household member was 17%. Like other studies we found young kids were less likely to be infected (8%). But this was only apparent in children less than <10 years old . Adults over >65 were more likely to get infected (30%) (2/5)
Sep 11, 2020 16 tweets 9 min read
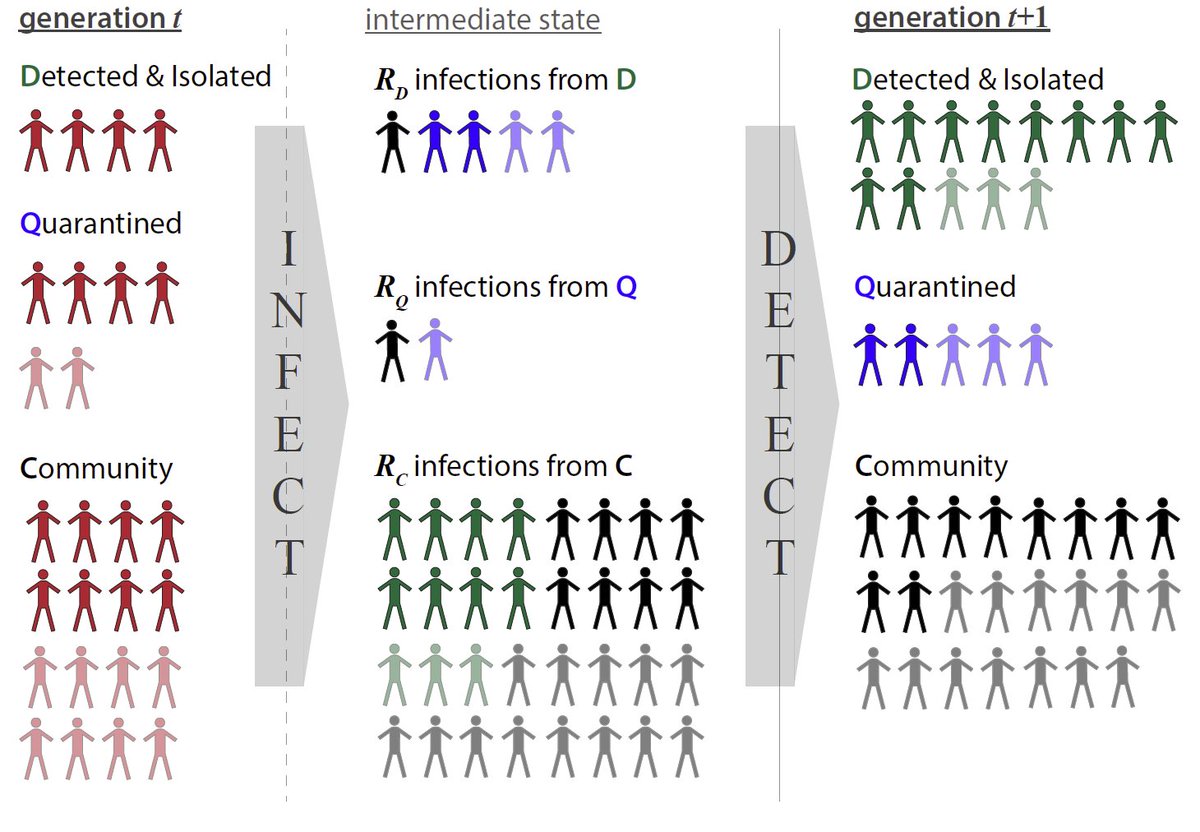
We had two preprints out last week. They might seem unrelated, but have lots to do with each other. In this thread I will outline the results and what they have to do with recent discussions around testing. @JHIDDynamics
doi.org/10.1101/2020.0…
(1/16) First, a shout out to all the folks who worked hard on these papers: @qifangb @andrewazman @khgrantz @ymax @lucystats @qhanlee @CJEMetcalf @EmilyGurley3
Also, note these have not been peer reviewed, so use caution in interpretation. (2/16)
Aug 29, 2020 5 tweets 3 min read
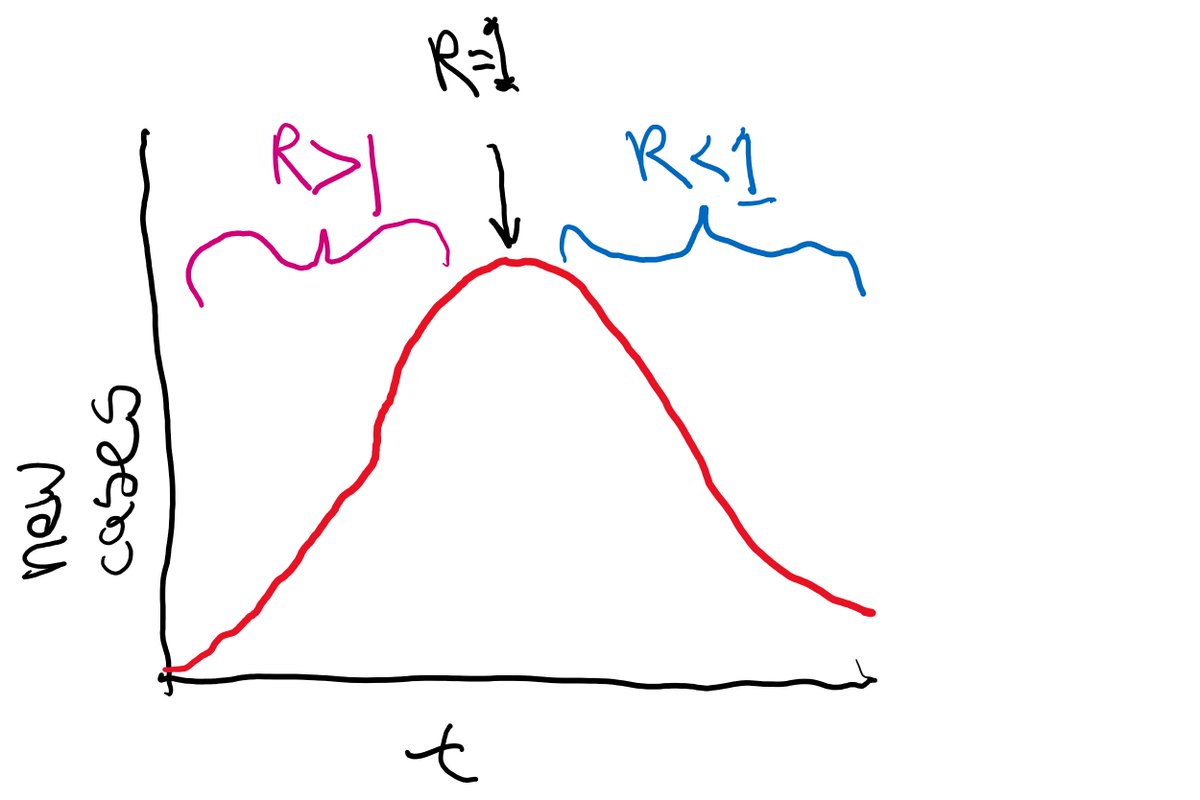
While I 100% agree with @DrTomFriden's skepticism about herd immunity kicking in at 20-30%, the logic of this statement is wrong. You can have a >50% attack rate if herd immunity kicks in at 30%, here is why....(1/5) When epidemiologists say there is #HerdProtection they mean that the reproductive rate, R, is less than or equal to 1, so cases will start. going down. So R=1 at the peak of an epidemic...(2/5)
Feb 11, 2020 7 tweets 3 min read
There were some questions about the meaning of our #covid19 analysis of the consistency between lack of observed onward transmission and Wuhan's R0, so @khgrantz and I put together a quick tweet thread to hopefully explain. 1/n If there is over-dispersion, fewer people are responsible for more of the overall transmission. For instance, a lower percentage of cases cause 80% of onward transmissions. When extreme, these are sometimes called superspreaders. 2/n Image