MSc,CAIIB,FRM,SCR,RAI,PRM,CMA,ACMA,IndianPivotBoss,Inventor of ATPM, pivotMUPS,pivotshift,FFF,DARS,RSI3 strategies;0 fee Trading Training;Ardent Rajnikant Fan…
May 15, 2022 • 7 tweets • 2 min read
#Freetip
How to find market tops or bottoms ?
Tools used by stalwarts like Stan Weinstein, Mark Minnervini, William O Neil, etc.
No. of stocks above 30 week MA (MAMB)
Steps : 1) Watch for Price making HH, but MAMB makes lower low; suggests top is near. Might take several weeks
...
In our N500 chart, it started from 16/07/2021 and made HH on 29/10/2021. (14 weeks) 2) Look for a bearish price action in weekly chart, like bearish engulfing, bearish pinbar, etc. This more or less confirms the top specifically. (29/10/21)
...
Dec 28, 2021 • 4 tweets • 3 min read
#FFF
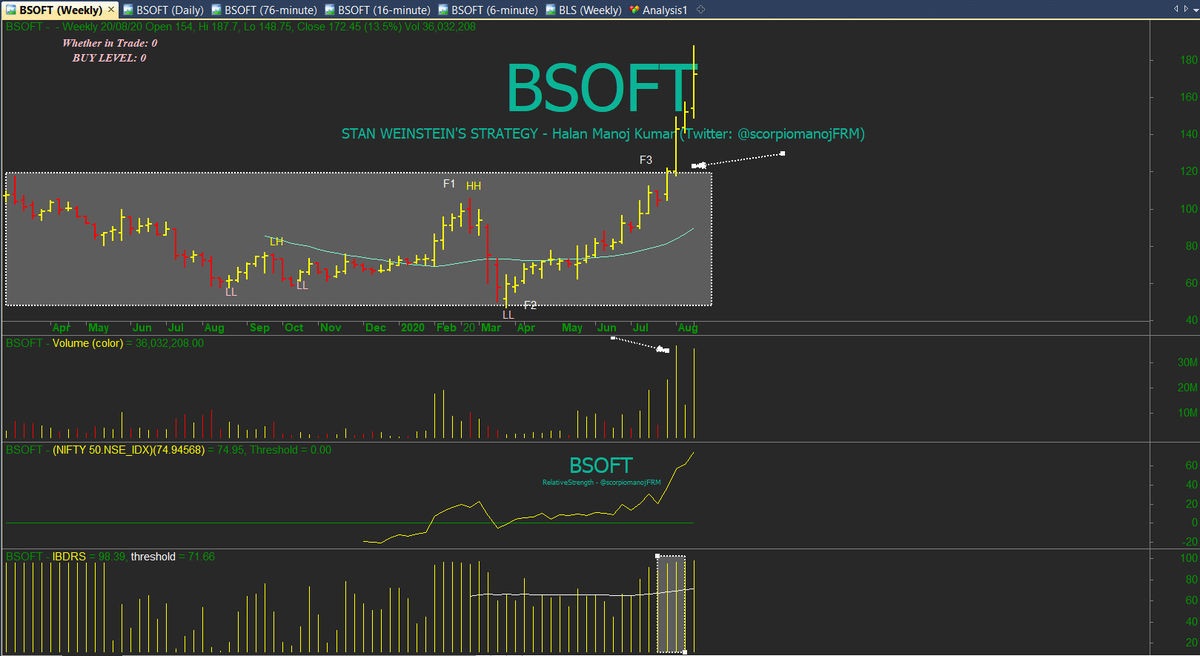
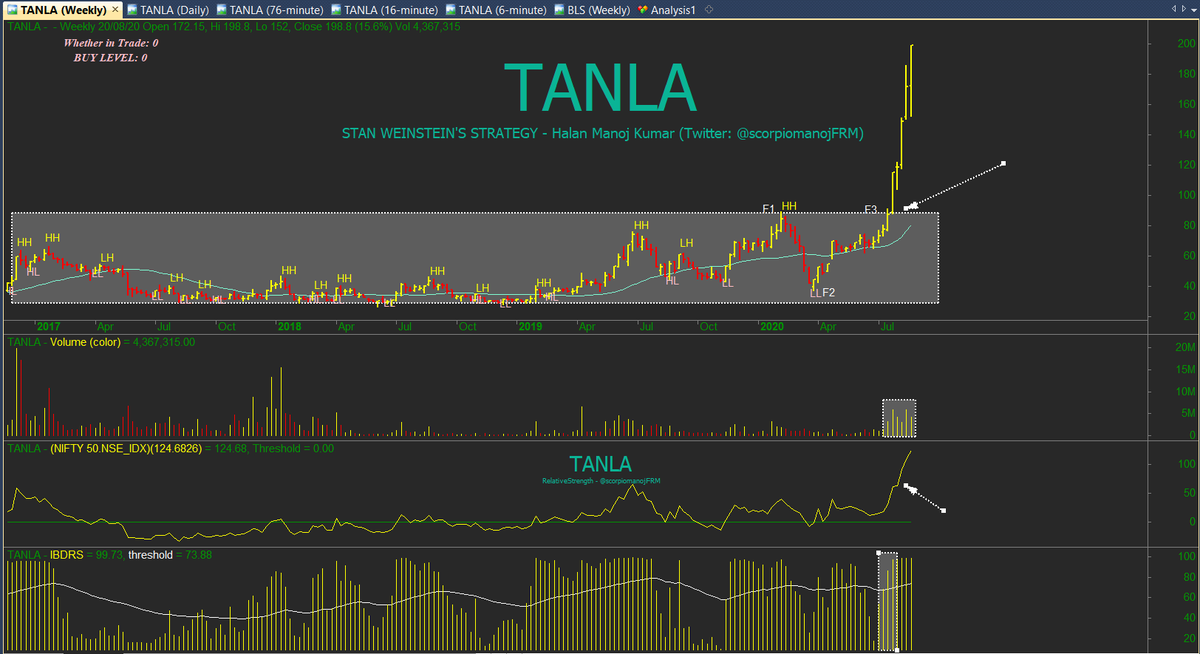
Old examples of FFF pattern at THAT POINT OF TIME (not handpicked now).
Look for similar patterns among microcap/small/midcap in that order for identifying multibaggers....
Spend lots of time during weekends looking for these patterns in HTF ... weekly/monthly. Good luck
Jul 18, 2021 • 7 tweets • 2 min read
#FreeTip
High probability strategy
Charges : Nil.
Name : MTF Inside bar (MInBar)
Everything right from the tool is provided here. All u need is to do a bit of home work and execute... 1) Scan for stocks with inside bar in 2 HTF, say monthly chart and weekly chart.
.... 2) Mark the high of the inside bar with a horizontal line. 3) Come to weekly chart. The monthly markings should be intact.
4)U will find an inside weekly bar as well. Mark the high of the inside weekly bar. 5) Now u have to go long when price goes above the high of ....
Jul 16, 2021 • 4 tweets • 2 min read
#Knowledge #Options
Ever wondered y gamma is the enemy of straddle / strangle sellers and what it means?
Presume readers are aware of option Greeks meaning...
To understand , first ...
Relationship between delta, gamma, theta and option premium.
....
....
Theta + (int Rate x Underlying price x Delta) + ( 0.5 x variance of underlying x Underlying price x Underlying Price x Gamma ) = Int rate x Option premium.
Strangle and straddles are delta neutral setup;For a delta neutral setup, the second term becomes zero; Hence,
...
Jun 18, 2021 • 7 tweets • 2 min read
#Reality
Step 1) Buy 500 stock A for intraday at 200 with stop of 197. 2) Stock moves to 205 slowly after an hour and u think ur entry is great and begin taking mtm screenshots to send to your friends. 3) Then comes a big red candle straight to 200. U assume it as retracement.
.
... 4) After few minutes of hovering near your cost, it begins to fall to 198. 5) U start becoming jittery. Ur mind which was tuned to only accept profits after watching mtm in point 2, is unable to accept loss. So u move your stop to 195. 6) Stock drops to 196....
Jun 16, 2021 • 5 tweets • 2 min read
#FreeTip
Basic rule for day trading in option buying for beginners. 1) Stick to monthly atm options. 2) Suppose u have a capital of Rs 5 lacs. Your max risk appetite is 1% which is 5k. Assume u look at BNF chart and find a buy setup at 35000 ...
...
with a stop of 34900 ( 100 point difference). This essentially means that the 35000 atm options will have a stop of Rs 200 ( delta 0.5) assuming all other things are equal. So the number of lots U should typically deal with based on 1% Risk on 5 lacs capital ...
Jun 12, 2021 • 4 tweets • 2 min read
#FreeTip
A simple illustration to analyse stocks in a very simple way: 1) Prepare a list of stocks with more than say, 400% returns last 1 year and currently above 3 digits. U will have around 30-40 NSE listed stocks. 2) Look at each stock chart just before breakout
.....
.... 3) Take a note book and right down against each stock, the behaviour of MAs Vis a vis the stock, for eg., 30 week MA / daily 200 ma / 150 ma, 50 ma, etc.); the behaviour of Relative Strength (RS); behaviour in terms of volume; any pattern like rectangular breakout etc.
...
Jun 12, 2021 • 4 tweets • 1 min read
#FreeTip
The math to do before entering trading: 1) Capital Rs 10 lacs 2) Risk per stock as a % of capital :1.25%, ie Rs 12.5k 3) Per stock max allocation: 12.5%, ie Rs 1.25L 4) Risk per stock as a % of position: Max 8%-10%, ie 12.5k 5) RR - 10%:20% , 1:2 , 12.5k : 25k
...
... 6) No. of trades likely during the year : 100 7) Win % : 40%, ie 40 trades 8) Projected End capital : 10L x (1+0.20)^(40) x (1-0.10)^(60) = 26 lacs, ie 164% return
It doesn’t mean that u will necessarily reach the end capital ; U will know if your activity ...
Sep 5, 2020 • 8 tweets • 2 min read
#Reality Market does not know resistances and supports in any form, like MA, pivots, fib, gann, MP,....; Market is only a flow of orders; An order in a terminal has two sides bid - ask; If ask side is taken out rightly without negotiation, it is bullish for that ....
....
moment. If bid side is given out rightly without negotiation, it is bearish for that moment. An extending bullish moment has intermediate bearish moments and vice versa. Sometimes bid side orders are way higher than ask side orders. This does not necessarily mean bullish....
Aug 29, 2020 • 6 tweets • 2 min read
#Research #Stat #Banknifty From Mar 2010 to Jan 2019
A) Open to Close abs %.
No. of trading days 2160
No. of days open to close > 1% = 750 (35%)
No. of days open to close > 2% = 247 (11.5%)
No. of days open to close > 3% = 58 (2.7%)
No. of days open to close > 4% = 13 (0.60%)
..
......
No. of days open to close > 5% = 4 (0.20%)
No. of days open to close > 6% = 2 (0.09%)
No. of days open to close > 7% = 0 (0%)
% is absolute of + / -, ie can be either up or down.
So essentially at the minimum one should ideally trade only 35% of the times intraday...
Aug 28, 2020 • 5 tweets • 2 min read
#Research
From Jan 1 till date - BNF 1) Total trading days 160 2) Open to Close of the day :
a) in excess of 100 points - 60 times
b) in excess of 200 points - 48 times
c) in excess of 300 points - 37 times
d) in excess of 400 points - 27 times
..
e) in excess of 500 points - 17 times
f) in excess of 600 points - 13 times
g) in excess of 700 points - 10 times
h) in excess of 800 points - 8 times
i) in excess of 900 points - 7 times
f) in excess of 1000 points - 4 times
g) in excess of 1500 points - 2 times
Let us take an eg of Nifty futures at 11000 and an equivalent OTM 11300 call with a delta of 0.33 and OTM put 10700 assuming a delta of -0.33.
It might appear that selling futures at 11000 (delta -1) technically equals....
....
selling 3 OTM 11300 calls (delta -0.33 X 3 = -0.99), at for eg 150.
Now let us assume futures moved up by 100. The percentage loss is 0.91%.
The price of the OTM calls is likely to go by 0.33 X 100, ie 33, meaning it will be at 188. The percentage loss is 25.3%.
....
Aug 14, 2020 • 7 tweets • 2 min read
#Learning
How to arrive at the equity market exposure (equity trading / investments)? 1) Expected Return :
Exp return = Risk Free return + Beta (Equity risk Premium)
Risk free return = 6% (10 year GSec yield)
Beta = Measure of the risk of you exposure vis a vis the broader mkt
.
.....
Since your exposure is in equity, beta can be kept as 1 if your strategy limits only to large caps; however if your strategy includes also mid / small caps / fno stocks, the actual beta will increase.....
Apr 24, 2020 • 6 tweets • 2 min read
#Learning#Options#Greeks
A layman explanation of option Greeks
a) Delta :
i) If delta is +0.6, it means if underlying changes by 1 unit the option changes by +0.6 units.
ii) Delta of long Call is positive (0 to 1) and long put is negative (-1 to 0)
.....
iii) Delta of ATM call option is 0.5, ITM is between 0.5 to 1 and OTM is 0 to 0.5. ( -ve for puts)
b) Gamma :
i) If gamma is 0.10, it means if underlying changes by one unit the delta changes by 0.10 units .
ii) Gamma of long options is always positive and gamma....
Apr 3, 2020 • 10 tweets • 2 min read
#Indiavix Mathematical Calculation of Indiavix explained in a more simpler manner: 1) Understanding Option pricing :
a) Option premium is a function of Underlying price, Time to expiry, int rates, Strike price and most importantly implied Volatility (implied standard dev).....
....
b) All these factors are combined together in the form of BSM (Black Scholes Model) to arrive at the option premium.
c) Important thing to rem is BSM assumes implied vol (IV) as constant and hence for a given IV, premium is calculated....
Jan 3, 2020 • 6 tweets • 2 min read
#Learning ‘Any thing can happen’ culminates from the concept that market movement is a factor of numerous known and unknown random variables; today’s gap down which is on account of a random variable called Trump/Iran variable shifted the entire market direction upside down...
.... in an otherwise up trending scenario; charts don’t reflect all random variables; it reflects only known random variable and markets expectation on them. For eg, coming budget is a known random variable, economic events like data announcement, monetary policy etc ....
Oct 18, 2019 • 4 tweets • 2 min read
#FreeTips
If price spends too much time at support / resistance, it is more likely that the support / resistance zone is very strong and price is very weak to break this zone. In other words, a support / resistance zone breakout is usually valid & convincing.....
if it happens at the least possible time, probably in one or a couple of candles. A breakout with many candles is probably a fake breakout. Characteristics of a breakout candle : a) Strong candle, ideally with more width than the previous candles and having better body %.....
Aug 20, 2019 • 7 tweets • 2 min read
#BANKNIFTY Blueprint for Tom 1) Pivot relationship - Lower Value 2) Pivot Width - Very narrow (CPR - 28015/28018/28021) 3) Range Width - Broad (27839-28215) 4) Cam L3/H3 - 27903/28113 5) Current pivot Vs Close - Closed below Current pivot (bearish)
…...
….. 6) Tom's pivot Vs close - Close below Tom's pivot (bearish) 7) Other supports - 27725 / 27683 / 27540 / 27425 / 27280 / 26800 (APART FROM PIVOT SUPPORTS) 8) Other resistances - 28450 / 28580
Possible strategy for Tom
……….
Aug 17, 2019 • 11 tweets • 2 min read
#BANKNIFTY Do you know?
BNF Weekly pivots:
BNF weekly pivots has formed an IV (Inside Value) relationship, meaning the weekly pivot for next week's trading is within the weekly pivots that was used for the current week. Now what does this signify?....
…..IV relationship has a higher possibility of market trending (NOT CERTAINITY) either up or down.
BNF Daily pivots:
Daily pivots for nxt day's trading having an HV relationship with prev day's pivots and price has closed above current and next day's pivots. Its meaning?....
� Arthur Cutten: Turned $1,000 dollars into over $90 million dollars.
� Richard Dennis: Turned $400 into $200 Million in 10 years.
� Ken Griffin: Started in a dorm room and at 38 is worth $3 BILLION!
...
....
� Dan Zanger: Pyramid $10,775 into $42 million in less than 2 years!
� Michael Marcus: Rolled out a $30,000 account into over $80 MILLION.
� Tom Baldwin: Parlayed $25,000 into over $2 Billion.
� Ed Seykota: Made 250,000 percent return on his account over 16 years!
...
Aug 16, 2019 • 5 tweets • 1 min read
#PIVOTS Do you know? There are 4 types of CPR relationship vis a vis Prev day cpr; 1)HB ( today’s cpr entirely above prev days cpr) 2) OHV ( today’s cpr partially above prev day cpr) 3) LV (today’s CPR entirely below prev days cpr) 4)OLV (today’s cpr partially below ....
....Prev days cpr) 5) IV (Inside Value) (Today’s cpr is within Prev day’s cpr) 6) OV ( Outside Value ) ( Today’s cpr is engulfing Prev days cpr) ; Each of this relationship denotes a clue; 1 is predominantly bullish, 2 mildly bullish, 3 bearish, 4 mildly bearish.....