
Happy to answer the @sdonnan question.
Quick answer:
1) Europe/ Germany has benefited from the U.S. stimulus;
2) U.S. isn't the entire global economy. Germany hurt by the fall in Turkey's imports, and the slowdown in Italy and China. Plus the decline of diesel.
1/x
Quick answer:
1) Europe/ Germany has benefited from the U.S. stimulus;
2) U.S. isn't the entire global economy. Germany hurt by the fall in Turkey's imports, and the slowdown in Italy and China. Plus the decline of diesel.
1/x
https://twitter.com/sdonnan/status/1084260478900232198
On the first point, let's start with the data for the world --
over the course of Trump's term, real import of manufactures are up 1.3 pp of US GDP, and real exports of manufactures are up 0.2 pp of GDP (best I can tell)
so a net stimulus to the world of ~ 1 pp of US GDP
over the course of Trump's term, real import of manufactures are up 1.3 pp of US GDP, and real exports of manufactures are up 0.2 pp of GDP (best I can tell)
so a net stimulus to the world of ~ 1 pp of US GDP

the rise in real imports in the last 2ys stems from an increase in US demand (e.g. the stimulus) not a structural increase in the openness of the US economy (or a big dollar move, the dollar move was in 14/15)

The bilateral data can be problematic (if the US imports more from China, China may buy more German machinery, etc). But the bilateral data shows a strong rise in US imports from the Euro area.

If you disaggregate the rise, it comes more from rising imports of capital goods (which helps Germany) than from rising imports of autos (which would help Germany too, but it isn't in the data)
Think the shift in US auto demand toward SUVs has limited overall auto imports
Think the shift in US auto demand toward SUVs has limited overall auto imports

US nominal goods imports from the EA are up about 15% over the last 7qs ($50b) - a positive impulse to the slow growing EA. Helps explain strong growth in late 17 in particular.
But US exports to EA also up, net impulse is more like $20b (noticeable, but not huge)
But US exports to EA also up, net impulse is more like $20b (noticeable, but not huge)

Drilling down even further, U.S. imports from Germany are also up by about 10% over the 7qs of Trump in dollar terms. Capital goods imports in particular have increased. But relatively weak demand for German autos has limited the impact
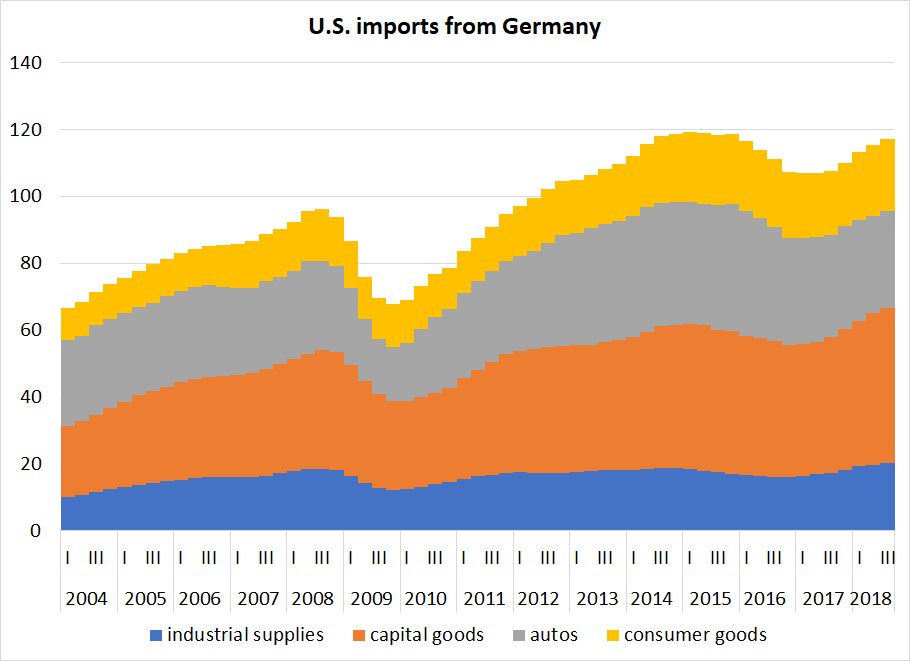
German imports are also up (German demand growth has been ok recently), so the net impulse appears smaller (tho as I mentioned Germany also benefits indirectly from the impulse the US provides to global demand)
Now a word about magnitudes --
German goods exports to the US (mostly manufactures) are about 3 pp of German GDP, so the 10% rise = + impulse of 0.3 pp of GDP (over 7qs)
for comparison US manufactured exports to the entire world are only around 5 pp of US GDP
German goods exports to the US (mostly manufactures) are about 3 pp of German GDP, so the 10% rise = + impulse of 0.3 pp of GDP (over 7qs)
for comparison US manufactured exports to the entire world are only around 5 pp of US GDP
you just don't get huge net impulses from trade most of the time -- a net drag/ contribution of 1 pp from trade is huge, so to speak and the most you typically see from any region is 10-20 bp in a year.
I have looked pretty carefully at the China shock for example, and you see a deterioration in the US trade balance with China (and Asia) of about 20 bp a year for 4-5 years. And is now recognized as a big shock.
And yes I have looked at the papers challenging Autor Dorn and Hansen. I just don't find them all that convincing (the key impact found by Autor Dorn and Hansen was a large regional shock in manufacturing centric parts of the country).
But that's for another time ...
But that's for another time ...
Now for why the downturn in Germany -
a) important to note the data lags. last data point for the US is q3, and the way I have done the data shows the change over the last 4qs, so it basically shows what happened in q4 17 to q2 18.
a) important to note the data lags. last data point for the US is q3, and the way I have done the data shows the change over the last 4qs, so it basically shows what happened in q4 17 to q2 18.
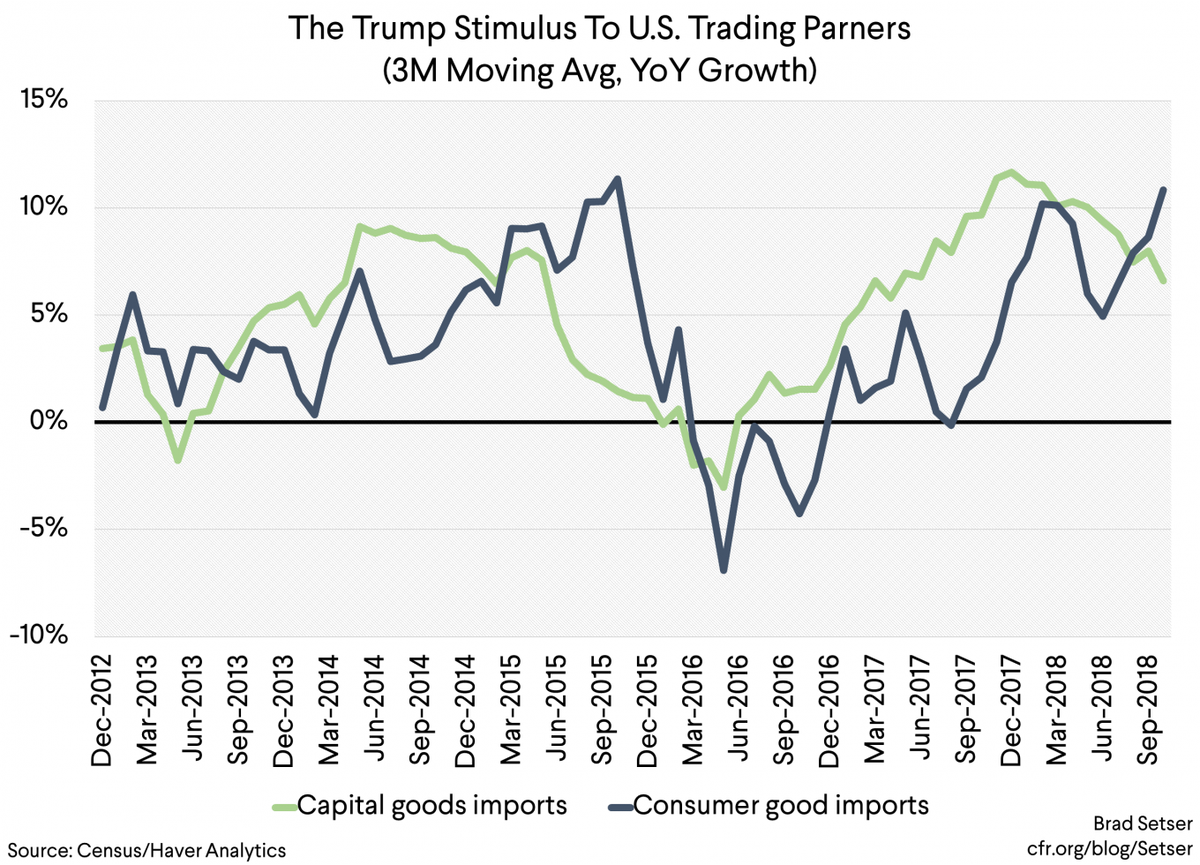
b) higher frequency indicators suggest that the growth in US capital goods imports (which helps Germany in particular) may have already slowed
and finally, the US is only 25% of the world economy, and Germany really sells to everyone --
German exports undoubtedly hurt by the big collapse in Turkish imports.
and by the slowdown in the rest of Europe
and -- while I haven't confirmed this in the data yet - by China.
German exports undoubtedly hurt by the big collapse in Turkish imports.
and by the slowdown in the rest of Europe
and -- while I haven't confirmed this in the data yet - by China.
Germany export about 1 pp of its GDP worth of autos and auto parts to China (data is on real exports here, not the sales of German marks in China). so the big year/year falls in Chinese auto demand in q4 likely hurt Germany too ...
All for now.
Have some data feeds at work that I will look at tomorrow ...
Have some data feeds at work that I will look at tomorrow ...
• • •
Missing some Tweet in this thread? You can try to
force a refresh


