The WSJ (Cezary Podkul and Megumi Fujikawa) on the search for global yield from Japan's financial institutions -- through the lens of Nochu's (Japan's financial cooperative for fishers and farmers) purchases of US CLOs

wsj.com/articles/how-a…
Podkul and Fujikawa allude to the centrality of the Caymans in the global flow of CLOs -- something the Fed highlighted last year

federalreserve.gov/econres/notes/…
The accounting here is interesting as it illustrates the role of tax centers in a range of capital flows, and illustrates the difference between gross and new flows too.

The Fed started categorizing US managed. Caymans domiciled CLOs as "foreign" in 17 and 18
As a result, corporate loans suddenly appear to be an important source of BoP financing for the United States ...
And this really is "just the Caymans --

That's where all the loans are technically being originated (for accounting purposes). They are of course managed by American institutions.

(see the Fed note)
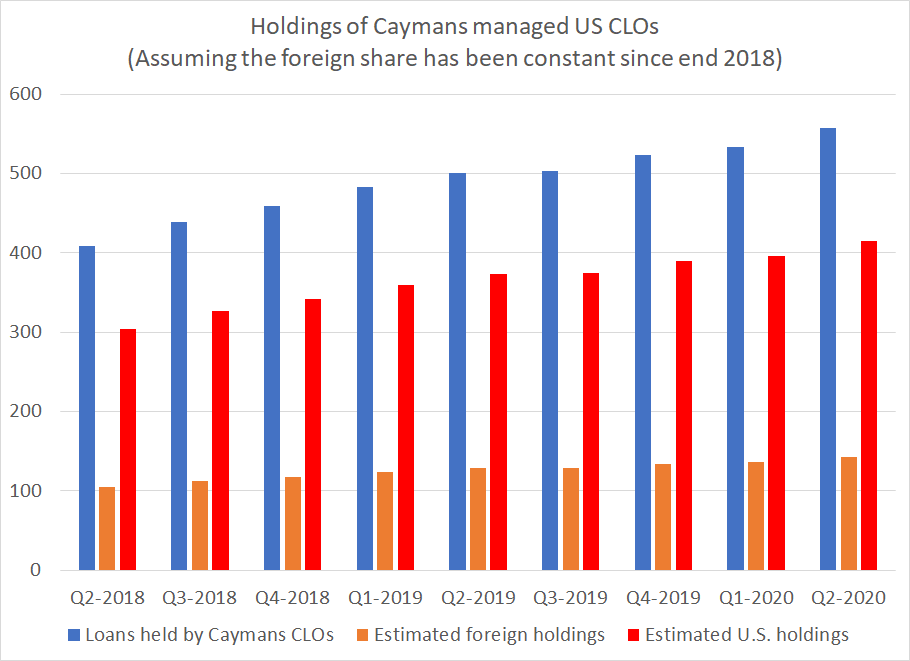
The bulk of the CLOs backed by these loans though have been sold back to US investors --

What appears as a foreign loan from the Caymans is really just the accounting for a CLO that has bought a bunch of US loans and repackaged those loans (mostly) for sale back to US investors
That's a lot of the world's gross flows --

US holdings of bonds (CLOs technically are bonds) issued in the Caymans are rising, as are loans from the Caymans to the US
Of course foreign investors (especially Nochu) have bought a portion of these CLOs too --

Good story highlighting what concretely the global reach for yield by Japanese institutional investors means

wsj.com/articles/how-a…

• • •

Missing some Tweet in this thread? You can try to force a refresh
 

Keep Current with Brad Setser

Brad Setser Profile picture

Stay in touch and get notified when new unrolls are available from this author!

Read all threads

This Thread may be Removed Anytime!

PDF

Twitter may remove this content at anytime! Save it as PDF for later use!

Try unrolling a thread yourself!

how to unroll video
  1. Follow @ThreadReaderApp to mention us!

  2. From a Twitter thread mention us with a keyword "unroll"
@threadreaderapp unroll

Practice here first or read more on our help page!

More from @Brad_Setser

6 Nov
The Council on Foreign Relations' graphics team has put together some good charts to support my recent piece warning about a loss of momentum in the global recovery.

cfr.org/article/global… Image
Plotting output relative to its 2019 average immediately puts the q3 recovery into context.

A look at the (still incomplete) data for a broader set of countries also highlights just how much of an outlier China's reportedly near complete recovery really is Image
A plot of (estimated) monthly US output highlights how the pace of the recovery slowed over the course of the third quarter (as the large initial stimulus was not sustained).

The chart also shows how services led this particular downturn Image
Read 9 tweets
3 Nov
The IMF needs to junk its current metric for assessing reserves.

It simply doesn't work. It dilutes what should be strong signals of extreme vulnerability.

cfr.org/blog/it-time-s…
The IMF's metric (without adjustments) suggested that Turkey had a slightly stronger reserve position that China going into 2020. Which is absurd.

(and yes, I do read the details of the IMF's ESR!)
The reason is simple: measures of reserve need based on broad money (m2) imply that countries with big domestic deposit bases (China, Korea and the like) need a ton of reserves, while countries with small banking systems (like Argentina) need far fewer
Read 9 tweets
1 Nov
A bit more on global debt issues, spurred by the @petersgoodman article.

As noted in the NYT, debt service deferral cannot be the only way to help low income countries, as not all low income countries are highly indebted.

Yet some countries really do have too much debt

1/x
As the chart above shows, African countries borrowed heavily between 2010 and 2019 -- so external debt, net of reserves, rose from around $100b to over $400b ...

That's a problem now, as exports (needed to repay external debt) are down. External debt is now 2x exports

2/x
And since most of the new debt has come from Chinese policy banks and the bond market not traditional bilateral lenders or the MDBs, it carries a fairly high (for Africa) interest rate. Interest payments are rising faster than total debt

3/x
Read 12 tweets
1 Nov
The New York Times (@petersgoodman) highlights how the global financial response to the pandemic, to date, has fallen short of providing the financial support low income countries need to cope effectively with the shock

1/x

nytimes.com/2020/11/01/bus…
Deferring debts owed to bilateral creditors was always going to only be a small part of the solution, but especially if China deemed key institutions like the CDB to be "private."

It was thus a mistake to make the DSSI the central mechanism for providing pandemic support

2/x
Only about $5b of the $30b in non-MDB debt coming due in 2020 will be rescheduled; the initiative has failed even on its own terms.

And since debt burdens aren't uniformly distributed, even a broad DSSI limited to bilateral creditors would not have provided enough to most

3/x
Read 8 tweets
30 Oct
Nice turn of phrase from @S_Rabinovitch. China's reported reserves have indeed been "uncannily steady" ....

economist.com/finance-and-ec… Image
This tho may be the most important bit --

... "currency traders sense the hand of the state, albeit more discreet than in the past. “My guess is that the central bank now has special trading accounts at the state banks" ...
I have long thought that you can get a more accurate picture of what China is really doing by adding the net foreign assets of the state banks to the PBOC's reported (CNY balance sheet) foreign exchange reserves -- which have indeed been a bit too steady for the last year + Image
Read 5 tweets
29 Oct
Today's GDP data obviously has gotten its share of coverage -- but I did want to highlight now unusual the downturn in q2 and partial recovery in q3 are. The downturn was led by services (usually the most stable component), and services are lagging the broader recovery

1/x Image
All this is looks totally crazy in the (annualized) contributions data, as, well, data wasn't designed for these kinds of swings.

But it is clear that goods consumption led the recovery

2/x Image
I de-annualized the data to put it on a more reasonable scale over the last year. Goods consumption is now 1.8 pp of US GDP higher than in q4 2019. Services consumption is down 2.7 pp of GDP

3/x Image
Read 7 tweets

Did Thread Reader help you today?

Support us! We are indie developers!


This site is made by just two indie developers on a laptop doing marketing, support and development! Read more about the story.

Become a Premium Member ($3/month or $30/year) and get exclusive features!

Become Premium

Too expensive? Make a small donation by buying us coffee ($5) or help with server cost ($10)

Donate via Paypal Become our Patreon

Thank you for your support!

Follow Us on Twitter!