The 2008 financial shock, which hit investment and imports hard and led China to respond with a big stimulus, tended to reduce trade imbalances.
The COVID-19 shock, to the surprise of many, is increasing transpacific trade imbalances (bigly)
1/x
wsj.com/articles/china…
The COVID-19 shock, to the surprise of many, is increasing transpacific trade imbalances (bigly)
1/x
wsj.com/articles/china…
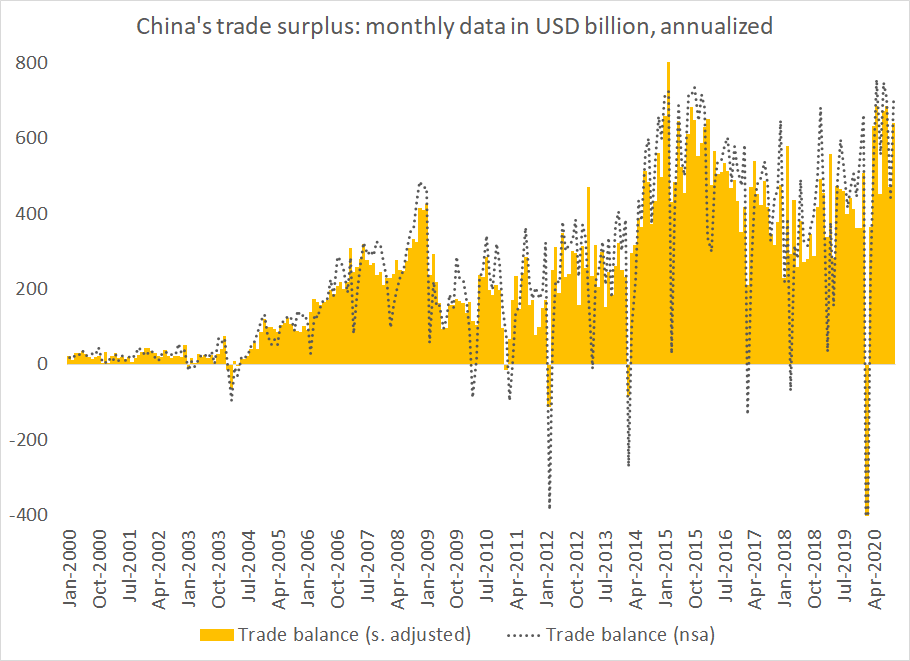
China's October trade surplus, annualized, was around $700b. The surplus typically doesn't hit its seasonal peak until December either. The trailing 12m sum of monthly surpluses is sure to soon top $500b, and is on a trajectory that takes it back to its $600b peak
2/x
2/x

Mechanically, the October surplus stemmed from a fall in imports from the usually high (no doubt inflated by Huawei's chip stockpiling) levels of September.
But the bigger story is that exports have remained relatively strong even as the global economy has been weak
3/x
But the bigger story is that exports have remained relatively strong even as the global economy has been weak
3/x

That export strength also is no longer just a function of PPE exports -- the main PPE export category in fact has been sliding over the last few months. But overall export growth has remained strong (+10% or so y/y in USD terms)
4/x
4/x

Equally striking, China's export boom has in part been driven by the US -- in the Chinese data (and the distinction here is important), exports to the US are back at their pre-trade war levels
5/x
5/x

in y/y terms, China's exports to the US are up over 20% ... admittedly off a low 2019 base, but the tariffs are largely still in place.
6/x
6/x

China's reported imports from the US are pretty much where they would normally be this time of year before the trade war (with a good harvest likely making up in part for Boeing weakness). No big windfall though
7/x
7/x

The most interesting story though, to me at least, is the huge gap between the Chinese data (on exports to the US) and the US data (on imports from China)
The gap is now close to 20 percentage points
8/x
The gap is now close to 20 percentage points
8/x

The trailing 12m sum of China's exports (trailing 12m sums move slowly, like the Alaska vote count) is now larger than the trailing 12m sum of US imports from China.
THAT SHOULD NOT HAPPEN
in the past, for known reasons, US imports were always higher than Chinese exports
THAT SHOULD NOT HAPPEN
in the past, for known reasons, US imports were always higher than Chinese exports

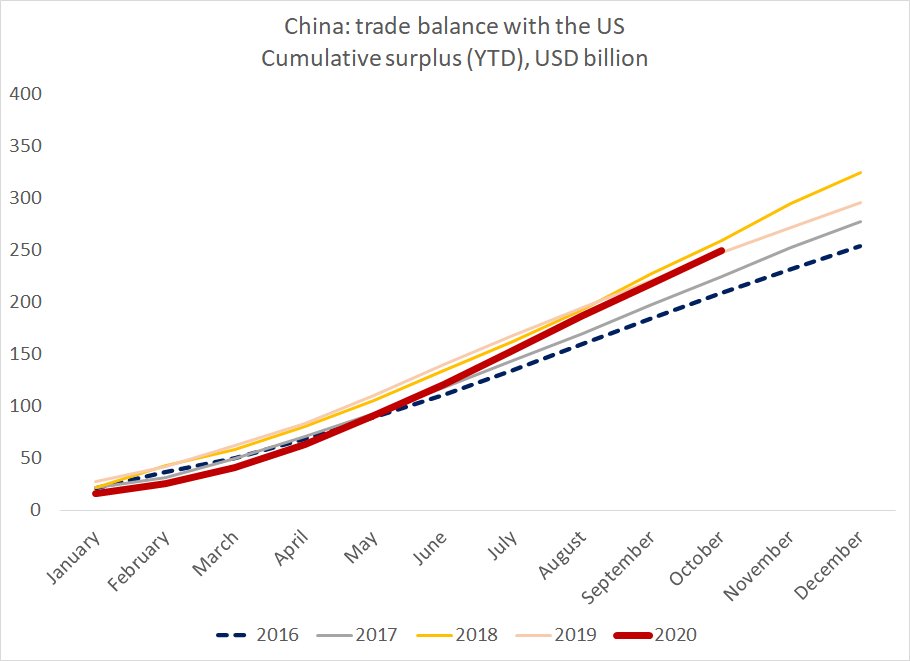
China's reported bilateral surplus with the US is also poised to exceed the reported US deficit with China this year.
Again, this should not be the case. US deficit is typically larger than the Chinese surplus
Again, this should not be the case. US deficit is typically larger than the Chinese surplus

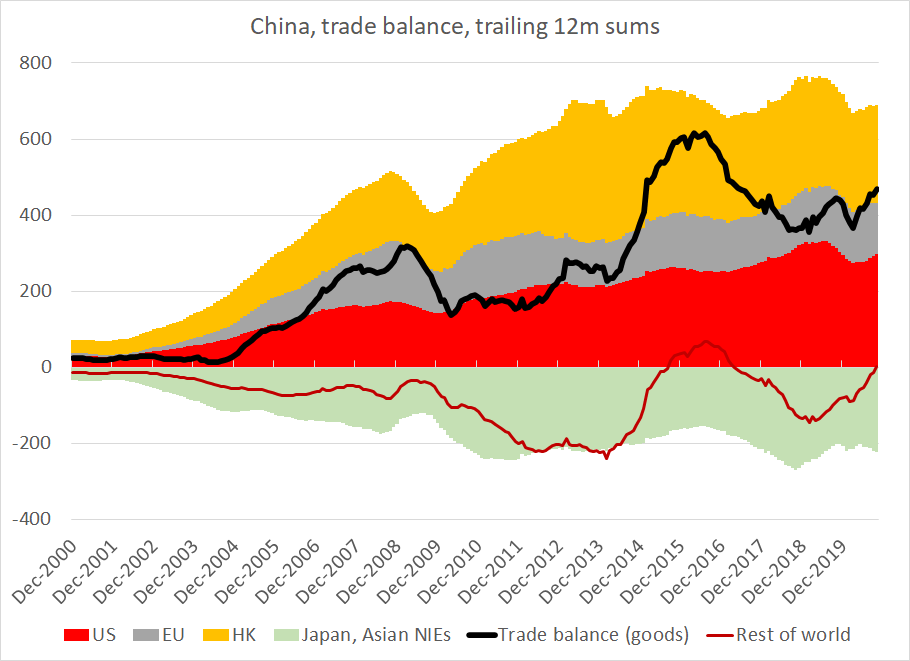
And in the global data for China, a rising surplus with the US (together with a big swing in China's trade balance with the commodity exporters) is driving the increase in China's overall surplus
11/x
11/x
The most obvious explanation for this "structural" shift is tariff avoidance -- as there is no doubt that the relative position of the red line (China's reported exports) and blue line (US reported imports) have shifted over the last 2 plus years.
12/x
12/x

But the result is the biggest divergence between the US and Chinese data in years. China is on track to perhaps report its biggest surplus with the US ever (even with tariffs and the pandemic)
(if you forecast out 20% y.y growth in China's exports in Nov and December)
13/x
(if you forecast out 20% y.y growth in China's exports in Nov and December)
13/x
While in the normally more reliable US data (as the US data used to capture through trade via HK better), the US trade deficit with China remains well below its previous peak levels
14/x
14/x

Would be great if more people started looking into this gap seriously -- tis one of the bigger data gaps to have opened up, and the US-China trade relationship is of obvious importance
15/x
15/x

But there should be no doubt that China's surplus in goods is back at all time highs.
And with less tourism, that translates into a big current account surplus (now ~$100b a quarter/ $400b a year if annualized) too
16/16
And with less tourism, that translates into a big current account surplus (now ~$100b a quarter/ $400b a year if annualized) too
16/16
• • •
Missing some Tweet in this thread? You can try to
force a refresh