China released its preliminary current account surplus data for q3 last week. Even with the unusual surge in imports in September (which was reversed in October) the surplus was about $50b higher than in 2019 (over $90b v $40b)
The trailing 4q sum rose to ~ $200b
But the $200b trailing 4q sum includes (obviously) a very weak q1, and a q4 that was no doubt influenced by trade war uncertainties. The Oct trade data hints that the rise in the surplus will be sustained in q4, which will pull the surplus into the $250-300b range for the year.
The current (s. adjusted) quarterly surplus (recognizing q2 may be a bit high and q3 a bit low) is ~ $90-100b. So broadly speaking, in dollar terms the surplus should rise to its pre-trade war highs and as a share of GDP it should rise to well over 2% of China's GDP
Some of this is reduced tourism, which may not last through all of 2021 if there is a widely used vaccine. And some of the increase in the manufacturing surplus is a function of what may be a one off shift in demand toward goods (v services) ...
But the broad trend is clear and even pre dates COVID-19. China is a very competitive manufacturing exporter at current exchange rates (even if the HK apparel magnates complain about labor costs on occasion). The current account surplus is heading toward its post GFC high
• • •
Missing some Tweet in this thread? You can try to
force a refresh
My vote is for Bloomberg. Has been a while since I did a chart that included gold (I have started looking at gold and fx reserves separately). But do think I was among the pioneers of substracting swaps from reported net reserves in a time series ...
China's October trade surplus, annualized, was around $700b. The surplus typically doesn't hit its seasonal peak until December either. The trailing 12m sum of monthly surpluses is sure to soon top $500b, and is on a trajectory that takes it back to its $600b peak
2/x
Mechanically, the October surplus stemmed from a fall in imports from the usually high (no doubt inflated by Huawei's chip stockpiling) levels of September.
But the bigger story is that exports have remained relatively strong even as the global economy has been weak
The Council on Foreign Relations' graphics team has put together some good charts to support my recent piece warning about a loss of momentum in the global recovery.
Plotting output relative to its 2019 average immediately puts the q3 recovery into context.
A look at the (still incomplete) data for a broader set of countries also highlights just how much of an outlier China's reportedly near complete recovery really is
A plot of (estimated) monthly US output highlights how the pace of the recovery slowed over the course of the third quarter (as the large initial stimulus was not sustained).
The chart also shows how services led this particular downturn
The WSJ (Cezary Podkul and Megumi Fujikawa) on the search for global yield from Japan's financial institutions -- through the lens of Nochu's (Japan's financial cooperative for fishers and farmers) purchases of US CLOs
The accounting here is interesting as it illustrates the role of tax centers in a range of capital flows, and illustrates the difference between gross and new flows too.
The Fed started categorizing US managed. Caymans domiciled CLOs as "foreign" in 17 and 18
The IMF's metric (without adjustments) suggested that Turkey had a slightly stronger reserve position that China going into 2020. Which is absurd.
(and yes, I do read the details of the IMF's ESR!)
The reason is simple: measures of reserve need based on broad money (m2) imply that countries with big domestic deposit bases (China, Korea and the like) need a ton of reserves, while countries with small banking systems (like Argentina) need far fewer
A bit more on global debt issues, spurred by the @petersgoodman article.
As noted in the NYT, debt service deferral cannot be the only way to help low income countries, as not all low income countries are highly indebted.
Yet some countries really do have too much debt
1/x
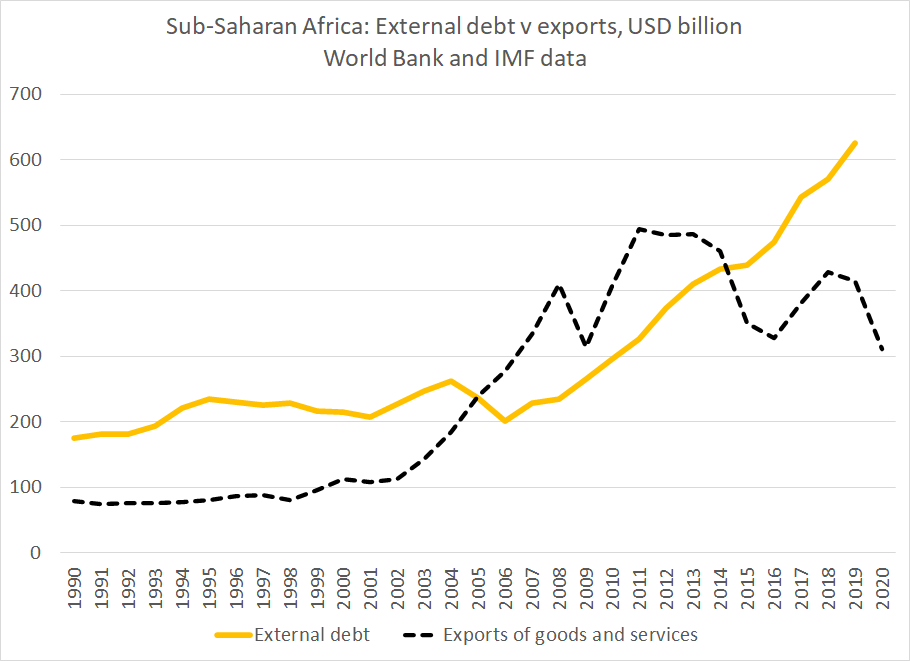
As the chart above shows, African countries borrowed heavily between 2010 and 2019 -- so external debt, net of reserves, rose from around $100b to over $400b ...
That's a problem now, as exports (needed to repay external debt) are down. External debt is now 2x exports
2/x
And since most of the new debt has come from Chinese policy banks and the bond market not traditional bilateral lenders or the MDBs, it carries a fairly high (for Africa) interest rate. Interest payments are rising faster than total debt