1/ something new on metadata of Wikileaks DNC emails. Hard to imagine that it's been overlooked so long. Result checks out from my spot checks. Binney and Larry Johnson report that DNC emails have FAT format and in three batches
turcopolier.typepad.com/sic_semper_tyr…
2/ FAT metadata saves timestamps only in even seconds 10:30, 10:32 etc. It is used on thumbdrives, while hard-drives timestamp to nanoseconds. I downloaded a couple of DNC emails (using wget in CMD to preserve timestamp) and spot checked that it was so. It was.
3/ they observed that Podesta emails were NOT in FAT format i.e. the FAT format did not appear to result from Wikileaks operations
4/ Forensicator had previously discussed presence of FAT formats in all documents in the second Guccifer2 zipfile (cf.7z) theforensicator.wordpress.com/cf-files-metad… and in top-level directories (rar) in the first zipfile (ngpvan)
5/ they report that the DNC emails were in three batches: on May 23, May 25 and August 26. It was already known (tho widely ignored) that DNC emails were hacked in the few days prior to May 25. (see @steemwh1sks). The May 23, 25 dates consistent; Aug 26 requires explanation
6/ note that Mueller report placed exfiltration of DNC emails between May 25 and June 1, an assertion that is inconsistent with latest email date (May 25). Mueller appears to have botched the precise dates by a week. Wonder how that happened?
6/ Binney and Johnston also discuss a peculiarity of Crowdstrike's conduct that I've discussed over and over, but which has got little resonance: the DNC email hack took place 4 weeks AFTER Crowdstrike knew that DNC had been hacked.
7/ an important point relating to Crowdstrike which Binney and Johnson didnt mention is that the emails fell into a narrow window from April 19 to May 25, with majority (including sensitive ones) being sent AFTER Crowdstrike and DNC knew about hack
climateaudit.org/2017/09/02/ema…
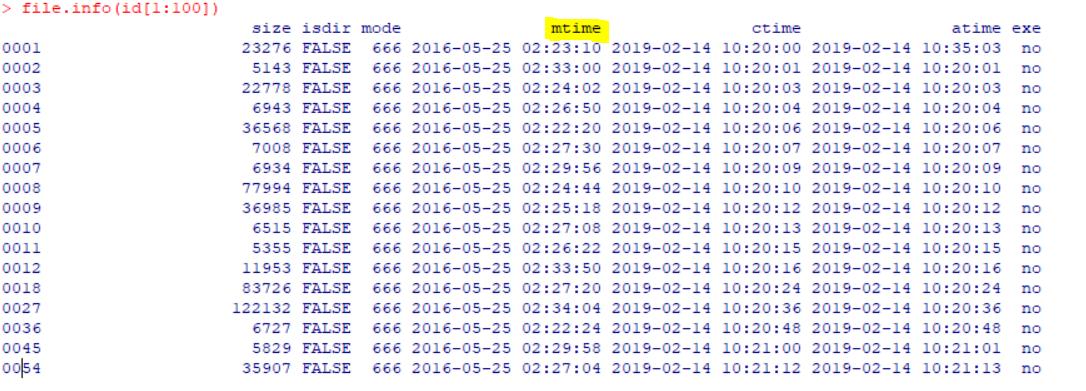
the image that I showed here is unhelpful as it only shows minutes.
7/ here's a better image confirming 2-second artifact. I downloaded from WL using wget to preserve timestamp and then used file.info in R to retrieve file metadata. Note that @bleidl challenges association of FAT with thumb drives.
8/ overall, I'm never been convinced by argument based on high July 5 copying speeds as this have been post-exfiltration copying. I don't think that there is any reasonable doubt that Podesta emails arose from same hacking program as Rinehart emails published at DCLeaks (syntax)
9/ I've also pointed out that some DNC email attachments turned up at DCLeaks. On balance, there's more evidence connecting DNC emails to DCLeaks hackers than to, say, Seth Rich-type leak. Conventional theory is far from disproven.
10/ on other hand, it seems to me that there's a considerable amount of arm-waving in Mueller indictment in relation to DNC emails and Guccifer 2. There are aspects of the whole matter that remain puzzling to me.
11/ I did my own sampling (every 100) of Wikileaks DNC emails. There's a fourth date that was missed by Binney and Johnson: Sep 21, 2016. It has about 9000-10000 emails.

• • •

Missing some Tweet in this thread? You can try to force a refresh
 

Keep Current with Stephen McIntyre

Stephen McIntyre Profile picture

Stay in touch and get notified when new unrolls are available from this author!

Read all threads

This Thread may be Removed Anytime!

PDF

Twitter may remove this content at anytime! Save it as PDF for later use!

Try unrolling a thread yourself!

how to unroll video
  1. Follow @ThreadReaderApp to mention us!

  2. From a Twitter thread mention us with a keyword "unroll"
@threadreaderapp unroll

Practice here first or read more on our help page!

More from @ClimateAudit

Feb 8
In today's thread, I'm going to excavate some fascinating data on Omicron vs Delta from a CDC article. On its face, it's a garden variety sermon on vaccination
cdc.gov/mmwr/volumes/7…, but it contains other interesting data that wasnt discussed by the authors.
2/ bear with some preliminaries so that the precise point is understood when I get to it. The underlying database is 222772 visits ("encounters") by adults to 383 US emergency depts and urgent care clinics and 87904 hospitalizations at 259 hospitals from Aug 26/21 to Jan 5/22.
3/ Delta variant was predominant for most of period; Omicron rapidly became dominant in Dec and, by Jan, Omicron (rather than vaccination) had more or less eliminated Delta. While authors stratify results by "Delta" and "Omicron" periods, unfortunately they didnt quantify lengths
Read 30 tweets
Jan 24
UK has published some relatively detailed data showing "unadjusted" rates of case infection of boosted vs unvax by age group.
assets.publishing.service.gov.uk/government/upl… As context, Ontario SciTable only shows "adjusted" case rate purporting to show unvax rate as twice that of vax (2 or more doses)
2/ in ALL UK ages above 30, "unadjusted" case infection rate for triple-vax was HIGHER than among unvax. These results troubled UK authorities who printed unadjusted unvax rates in light gray, warning "comparing case rates ...should not be used to estimate vaccine effectiveness"
3/ the UK conclusion that "comparing case rates among vaccinated and unvaccinated populations should not be used to estimate vaccine effectiveness against infection" will come as news to Ontario SciTable and other authorities which regularly use such data in briefings
Read 14 tweets
Jan 16
Quebec, in midst of draconian lockdown, (unlike Ontario) publishes new hospitalization data by age group, vax status msss.gouv.qc.ca/professionnels…

These are real counts, neither "normalized" relative to population nor "adjusted" by Ontario Science Table (or CDC). What do you notice? Image
2/ the most obvious observation about new hospitalizations is that (unsurprisingly) they are dominated by seniors and particularly over 80s - a group which is almost totally vaxxed.
3/ a secondary observation is that, in younger agegroups, number of new hospitalizations among unvax is pretty similar to number of new hospitalizations among vax, even though population of unvax is much smaller. This is consistent with primary messaging from governments.
Read 17 tweets
Jan 12
in response to recent threads in which I showed actual vax and unvax case counts (not just per million), I've been abused by many commenters for my supposed failure to understand "data science 101" - that ONLY per million matters and only a moron would look at counts.
2/ I suspect that most of the abusive commenters are much younger than me and thus fail to consider why actual counts of fully-vax cases are of particular concern to someone who is fully vax and in a vulnerable age group (like me.)
3/ Nearly every 80+ and 70+ in Ontario was fully vax in Dec; yet there was unprecedented explosion of cases among seniors in mid-Dec. This is NOT due to almost non-existent unvax seniors. I wish it were. Yes, the few unvax are at more risk. But they arent causing senior caseload
Read 15 tweets
Jan 11
the actual operating problem for Ontario govt - what puts pressure on hospitals and ICUs - is most likely the dramatic resurgence of cases among Ontario seniors, even including 99.99% fully-vax 80+s.
2/ it is well known that hospitalization and ICU rates for senior COVID cases are FAR higher than younger cohorts. In Toronto, where fine-grained data is available, 34% of cases among 80-90s are hospitalized; 25% of cases among 70-79s hospitalized, 5.8% into ICU
3/ in November, the priority of federal government and Science Table appears to have been vaccinating 5-11 year olds, as opposed to boosting seniors. "Younger" seniors (60s and 70s) mostly wer not eligible for boosters until December due to 6-month federal regulation.
Read 4 tweets
Jan 10
today's Ontario cases are down almost 50% from Jan 1 max. Fully-vax cases accounted for ~85% of all cases; on a per million basis, fully vax cases still are higher than unvax cases. SciTable shows increasing cases, with "adjusted" unvax cases exceeding vax cases on per MM basis.
2/ here is today's NON-ICU hospitalizations, absolute and per million, by status. About 75% of non-ICU hospitalizations are full vax, flipping ratio that applied earlier in pandemic. Relative unvax rates remain higher.
3/ to estimate "excess" unvax non-ICU occupancy, I calculated what non-ICU numbers for unvax "should have been" if they had same relative occupancy as full-vax. It was ~100 extra for most of 2021, now ~150. This is 8% of present 1925 non-ICU occupancy.
Read 15 tweets

Did Thread Reader help you today?

Support us! We are indie developers!


This site is made by just two indie developers on a laptop doing marketing, support and development! Read more about the story.

Become a Premium Member ($3/month or $30/year) and get exclusive features!

Become Premium

Don't want to be a Premium member but still want to support us?

Make a small donation by buying us coffee ($5) or help with server cost ($10)

Donate via Paypal

Or Donate anonymously using crypto!

Ethereum

0xfe58350B80634f60Fa6Dc149a72b4DFbc17D341E copy

Bitcoin

3ATGMxNzCUFzxpMCHL5sWSt4DVtS8UqXpi copy

Thank you for your support!

Follow Us on Twitter!

:(