UK has published some relatively detailed data showing "unadjusted" rates of case infection of boosted vs unvax by age group.
assets.publishing.service.gov.uk/government/upl… As context, Ontario SciTable only shows "adjusted" case rate purporting to show unvax rate as twice that of vax (2 or more doses)
2/ in ALL UK ages above 30, "unadjusted" case infection rate for triple-vax was HIGHER than among unvax. These results troubled UK authorities who printed unadjusted unvax rates in light gray, warning "comparing case rates ...should not be used to estimate vaccine effectiveness"
3/ the UK conclusion that "comparing case rates among vaccinated and unvaccinated populations should not be used to estimate vaccine effectiveness against infection" will come as news to Ontario SciTable and other authorities which regularly use such data in briefings
4/ UK public health purported to explain this surprising conclusion in a page 38 footnote that said "unadjusted crude rates do not take into account underlying statistical biases in the data and there are likely to be systematic differences between these 2 population groups"
5/ their fourth reason was that unvax were "more likely to have caught COVID-19 in the weeks or months before the period covered in the report. This gives them some natural immunity which may have contributed to a lower case rate in past few weeks".
6/ if, as UK public health say here, natural immunity from prior infection is giving better protection against infection than even triple doses, why isn't that recognized in public policy?
7/ reason three: "many of those who were at head of queue for vaccination are those at higher risk from COVID-19 due to age, occupation, family circumstances or underlying health issues". Uh, data in table was already stratified by age group.
8/ "people who are fully vaccinated and people who are unvaccinated may behave differently, particularly with regard to social interactions and therefore may have differing levels of exposure to COVID-19". If unvax people are behaving more prudently, why do they merit punishment?
9/ "testing behaviour is likely to be different between people with different [vax] status, resulting in differences in chances of being identified as a case".
They seem to hypothesize that vax are more likely to get COVID test for very mild symptoms than unvax, inflating count
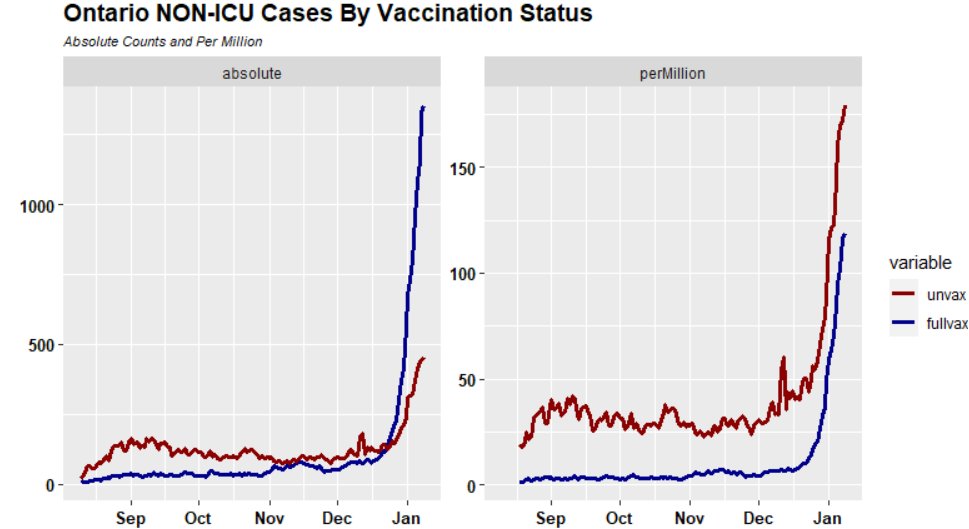
10/ "unadjusted" UK case rate data also shows substantial protection for vax in respect to hospitalization and death. That part is in accordance with expectations and messaging.
11/ although UK public health authorities warned that comparison of case rates "should not be used" to estimate vaccine effectiveness against infection, it expressed no such reservations in respect to hospitalization and death rates.
12/ here's a barplot from UK data (Table 9) here assets.publishing.service.gov.uk/government/upl… contrasting unvax cases by agegroup in 4 weeks Dec-Jan with vax cases. What do you notice?
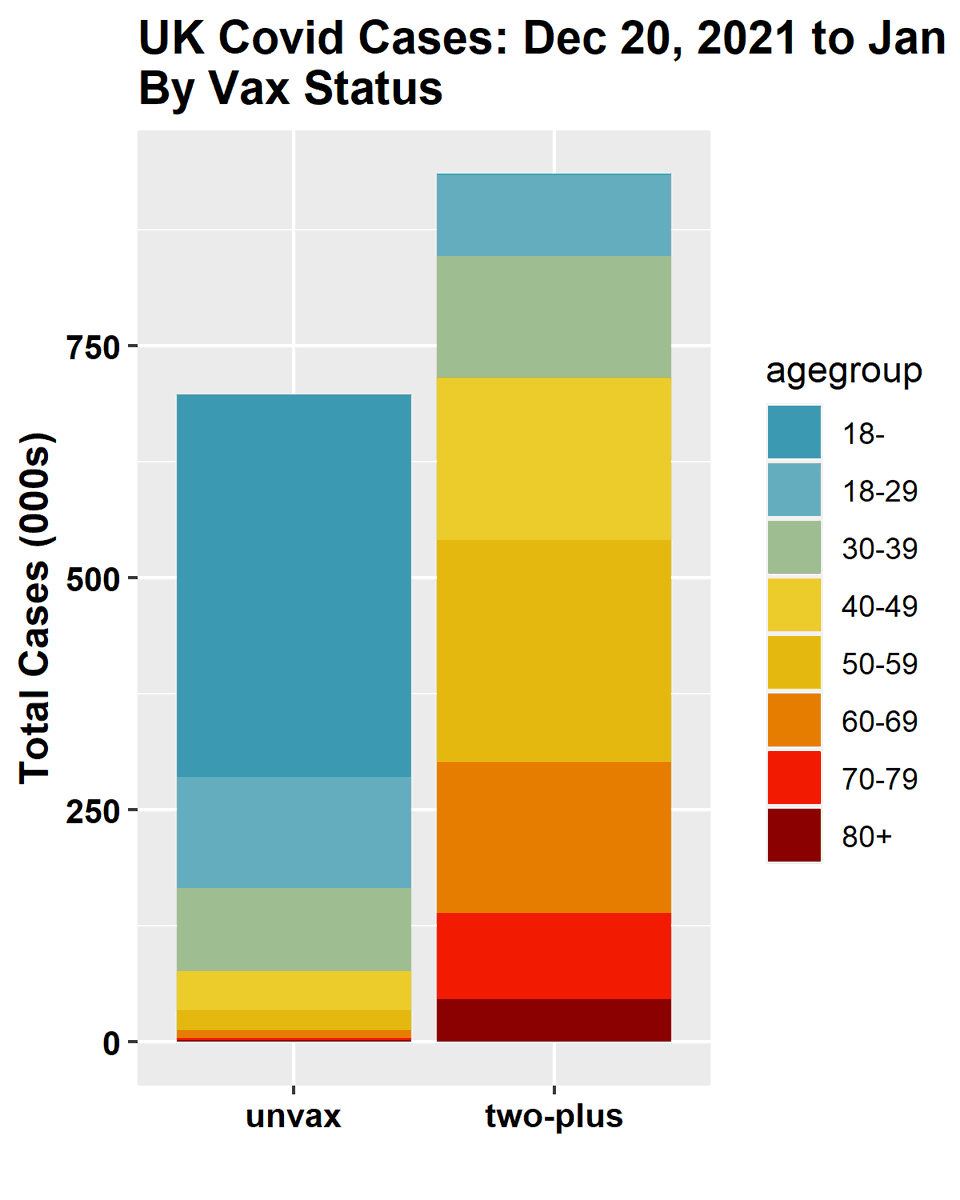
13/ what stuck out for me: the age composition of unvax cases is totally different than age composition of vax cases. Unvax cases in UK are overwhelmingly under 30, while majority of vax cases are over 50, with very large number of 70 and even very vulnerable over-80s.
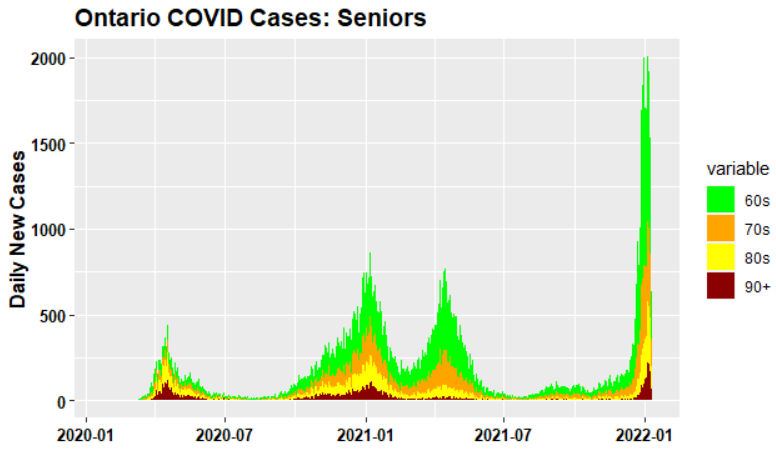
14/ so there are two related but somewhat different things going on: a rapid resurgence of COVID among vaxxed seniors and an explosion of cases among unvax young people.

• • •

Missing some Tweet in this thread? You can try to force a refresh
 

Keep Current with Stephen McIntyre

Stephen McIntyre Profile picture

Stay in touch and get notified when new unrolls are available from this author!

Read all threads

This Thread may be Removed Anytime!

PDF

Twitter may remove this content at anytime! Save it as PDF for later use!

Try unrolling a thread yourself!

how to unroll video
  1. Follow @ThreadReaderApp to mention us!

  2. From a Twitter thread mention us with a keyword "unroll"
@threadreaderapp unroll

Practice here first or read more on our help page!

More from @ClimateAudit

Jan 16
Quebec, in midst of draconian lockdown, (unlike Ontario) publishes new hospitalization data by age group, vax status msss.gouv.qc.ca/professionnels…

These are real counts, neither "normalized" relative to population nor "adjusted" by Ontario Science Table (or CDC). What do you notice? Image
2/ the most obvious observation about new hospitalizations is that (unsurprisingly) they are dominated by seniors and particularly over 80s - a group which is almost totally vaxxed.
3/ a secondary observation is that, in younger agegroups, number of new hospitalizations among unvax is pretty similar to number of new hospitalizations among vax, even though population of unvax is much smaller. This is consistent with primary messaging from governments.
Read 17 tweets
Jan 12
in response to recent threads in which I showed actual vax and unvax case counts (not just per million), I've been abused by many commenters for my supposed failure to understand "data science 101" - that ONLY per million matters and only a moron would look at counts.
2/ I suspect that most of the abusive commenters are much younger than me and thus fail to consider why actual counts of fully-vax cases are of particular concern to someone who is fully vax and in a vulnerable age group (like me.)
3/ Nearly every 80+ and 70+ in Ontario was fully vax in Dec; yet there was unprecedented explosion of cases among seniors in mid-Dec. This is NOT due to almost non-existent unvax seniors. I wish it were. Yes, the few unvax are at more risk. But they arent causing senior caseload
Read 15 tweets
Jan 11
the actual operating problem for Ontario govt - what puts pressure on hospitals and ICUs - is most likely the dramatic resurgence of cases among Ontario seniors, even including 99.99% fully-vax 80+s.
2/ it is well known that hospitalization and ICU rates for senior COVID cases are FAR higher than younger cohorts. In Toronto, where fine-grained data is available, 34% of cases among 80-90s are hospitalized; 25% of cases among 70-79s hospitalized, 5.8% into ICU
3/ in November, the priority of federal government and Science Table appears to have been vaccinating 5-11 year olds, as opposed to boosting seniors. "Younger" seniors (60s and 70s) mostly wer not eligible for boosters until December due to 6-month federal regulation.
Read 4 tweets
Jan 10
today's Ontario cases are down almost 50% from Jan 1 max. Fully-vax cases accounted for ~85% of all cases; on a per million basis, fully vax cases still are higher than unvax cases. SciTable shows increasing cases, with "adjusted" unvax cases exceeding vax cases on per MM basis.
2/ here is today's NON-ICU hospitalizations, absolute and per million, by status. About 75% of non-ICU hospitalizations are full vax, flipping ratio that applied earlier in pandemic. Relative unvax rates remain higher.
3/ to estimate "excess" unvax non-ICU occupancy, I calculated what non-ICU numbers for unvax "should have been" if they had same relative occupancy as full-vax. It was ~100 extra for most of 2021, now ~150. This is 8% of present 1925 non-ICU occupancy.
Read 15 tweets
Jan 9
today's disinformation from Ontario Science Table. Local to me, but prob representative of science advice elsewhere. Left- ACTUAL hospitalization data by vax status. Right - hospitalization infographic from Science Table. Look at difference,
2/ up to mid-Dec, actual COVID hospitalizations were dominantly unvax, with only handful of full_vax. In last 3 weeks, reported hosp'ns exploded, with vast majority being two-plus vax. While unvax proportion is higher, "problem" arises from absolute count. Which is now mostly vax
3/ SciTable infographic implies that onslaught of hospitalizations is coming from unvax, with vax hospitalizations making only a minor contribution. No wonder politicians are demonizing unvax. While unvax "over-contribute", they are not driving the increase. Contrary to SciTable
Read 25 tweets
Jan 8
Here's a startling graph illustrating a point that people are beginning to talk about, but not visualizing well. And showing that concepts from 6 weeks ago aren't applying. Changes in ratio of new cases PER 100K of fully vax to unvax. Image
data is from Ontario, but it sounds like US experience is at least directionally similar. Vaccines were doing excellent (even if not perfect) job against cases, not just against ICU and hospitalization. In midDecember, with arrival of omicron, advantage disappeared, then reversed Image
the erosion of relative advantage of fully vax to unvax in respect to non-ICU hospitalization also began in mid-December, eroding rapidly. Opinions based on data prior to mid-December are no longer valid. Image
Read 19 tweets

Did Thread Reader help you today?

Support us! We are indie developers!


This site is made by just two indie developers on a laptop doing marketing, support and development! Read more about the story.

Become a Premium Member ($3/month or $30/year) and get exclusive features!

Become Premium

Too expensive? Make a small donation by buying us coffee ($5) or help with server cost ($10)

Donate via Paypal

Or Donate anonymously using crypto!

Ethereum

0xfe58350B80634f60Fa6Dc149a72b4DFbc17D341E copy

Bitcoin

3ATGMxNzCUFzxpMCHL5sWSt4DVtS8UqXpi copy

Thank you for your support!

Follow Us on Twitter!

:(