In today's thread, I'm going to excavate some fascinating data on Omicron vs Delta from a CDC article. On its face, it's a garden variety sermon on vaccination
cdc.gov/mmwr/volumes/7…, but it contains other interesting data that wasnt discussed by the authors.
cdc.gov/mmwr/volumes/7…, but it contains other interesting data that wasnt discussed by the authors.


2/ bear with some preliminaries so that the precise point is understood when I get to it. The underlying database is 222772 visits ("encounters") by adults to 383 US emergency depts and urgent care clinics and 87904 hospitalizations at 259 hospitals from Aug 26/21 to Jan 5/22.

3/ Delta variant was predominant for most of period; Omicron rapidly became dominant in Dec and, by Jan, Omicron (rather than vaccination) had more or less eliminated Delta. While authors stratify results by "Delta" and "Omicron" periods, unfortunately they didnt quantify lengths
4/ to be more precise, the underlying dataset is ED and UC "encounters among adult with COVID-19-like illness*" , defined as "acute respiratory illness (e.g., COVID-19, respiratory failure, or pneumonia) or related signs or symptoms (cough, fever, dyspnea, vomiting, or diarrhea)"


5/ for four distinct vax statuses and for both Delta and Omicron dominant periods, they showed total encounters, hospitalizations, COVID cases and COVID hospitalizations.
If they'd given lengths of each period, we (or they) could calculate daily rates. Why was this omitted?
If they'd given lengths of each period, we (or they) could calculate daily rates. Why was this omitted?

6/ later, I'll try to approximate this calculation. In meantime, perhaps the most obvious question about Omicron vs Delta is percentage of hospitalizations - which, overall, dropped from 42.2% in Delta period to 8.7% (!!) in Omicron period. Why didn't authors show this?

7/ the hospitalization percentage dropped dramatically in ALL vax categories: boosted, fully vax, and unvax alike.
There's something else that's surprising in this data. I'll explain after I have coffee.
There's something else that's surprising in this data. I'll explain after I have coffee.

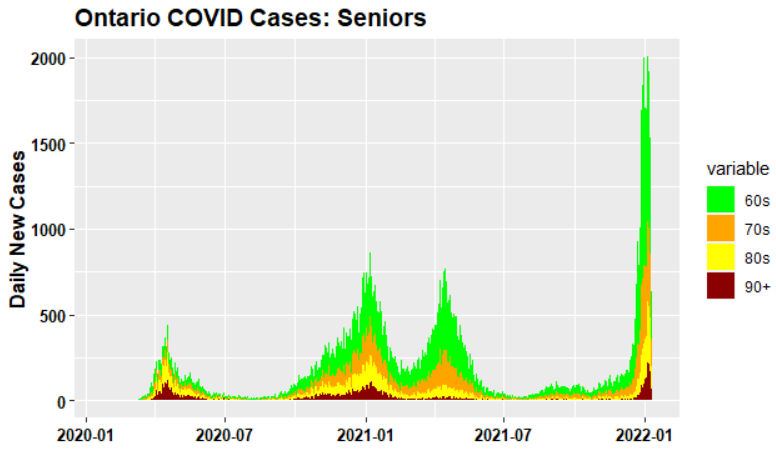
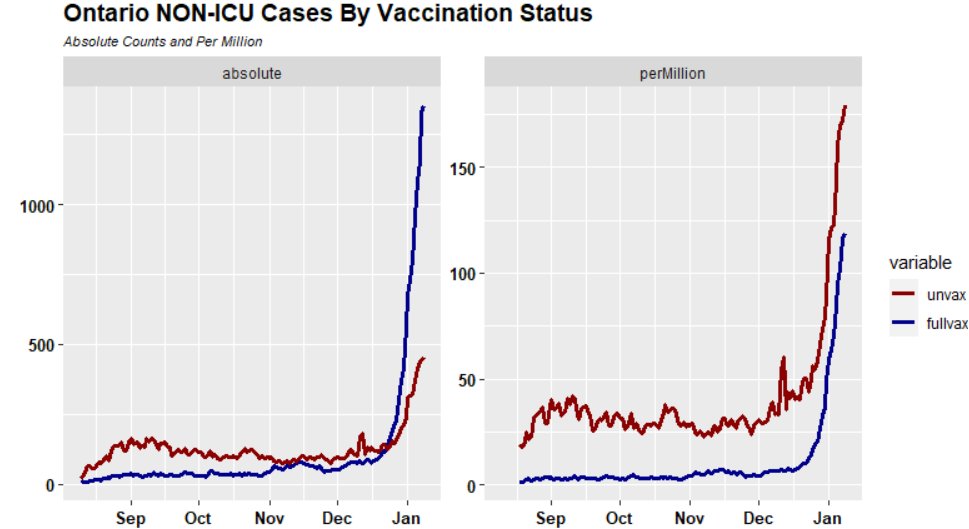
8/ Here's something odd. We hear repeatedly that unvax are hospitalized at MUCH greater rate than vax (see Ontario Sci Table below), but in CDC report, % hospitalized among triple vax is higher than among unvax.
Comparison is not apples-to-apples, but, for now, shows complexity
Comparison is not apples-to-apples, but, for now, shows complexity


9/ unlike most datasets, this CDC dataset includes information on "non-COVID" hospitalizations of people with "COVID-like" symptoms. And, somewhat surprisingly, it turns out that non-COVID accounts for ~80% of COVID-like hospitalizations.
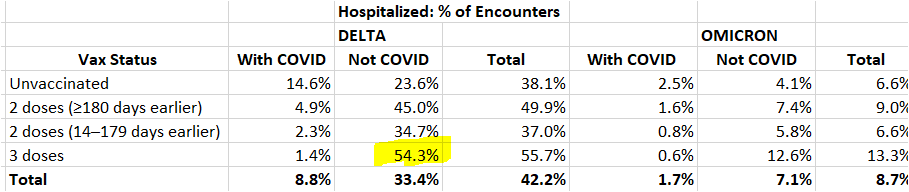
10/ columns for COVID hospitalization show expected decrease in COVID % hospitalization. But look at "Not COVID" hospitalizations (calculated as total "COVID-like" minus COVID). In Delta, 55.7% triple vax visits with COVID-like symptoms hospitalized, but only 1.4% COVID cases

11/ this same phenomenon continued into Omicron period but at MUCH lower levels: from visits with COVID-like symptoms, COVID hosps were lower (0.6% vs 2.5%) for triple vax vs unvax, but total hosps higher (13.3% vs 6.5%).

12/ while the decrease in % hospitalized COVID in Omicron period is startling, what is perhaps just as startling is the corresponding decrease in non-COVID respiratory hospitalizations.
13/ I don't know why - this can't be deduced from statistics. However, from purely statistical and analytic perspective, I think that this is an elephant-in-the-room question that ought to have been addressed by authors, whose preoccupation with vax wars made them inattentive
14/ while we mostly hear about COVID hospitalizations, this table shows rest of story for visits with COVID-like symptoms: not-COVID hosps, not-hosp COVID cases, not-hosp and not-COVID. Huge increas in both not-hosp COVID cases AND not-hosp not-COVID cases.

15/ a couple of points on extrapolation of this data to Canada: the proportion of vaccination in Canada is MUCH higher than in this US data.
Also, hospitalizations in late-December and January in Canada were higher than preceding Aug-Dec period, opposite to this US data.
Also, hospitalizations in late-December and January in Canada were higher than preceding Aug-Dec period, opposite to this US data.
16/ @rupasubramanya drew attention a couple of weeks ago to an Ontario special study that showed that vast majority of hospitalizations in December were Delta, rather than Omicron, even though Omicron rapidly became dominant in last two weeks of December.
17/ she (IMO sensibly) argued that Omicron would be as mild in Canada as it was elsewhere and attributed the surge in Canadian hospitalizations in late December to effect of lingering Delta, rather than Omicron being uniquely severe in Canada
18/ be that as it may, this US study, like similar studies elsewhere, indicates that hospitalization and severe outcomes from Omicron are so much less than from Delta that sensible public policy requires that the two variants be tracked separately in health statistics.
19/ there's a very ironic outcome that illustrates the combined cynicism and divisiveness of Trudeau's recent politics.
20/ During past month, the purpose of vaccination has been re-framed as a national effort to reduce hospitalization rates (rather than transmission, which it was no longer accomplishing.) But this US (and other) data indicates that Omicron reduces hospitalization rates even more.
21/ not just that, but Omicron has wiped out Delta. In a few weeks, Omicron accomplished something that months of vaccination failed to do.
22/ If hospitalization rates under Omicron, even for unvax, turn out better than we were able to attain for Delta even with boosters, shouldn't we be ending mandates and lockdowns (like the rest of the world), rather than doubling down on lockdowns and ostracizing the unvax?
23/ Trudeau and public health authorities constantly lecture us to "follow the science". But to follow the science, Canadian public health authorities need to publish up-to-date and honest data stratified by variant, vax status and age group. But we don't get that from Trudeau
24/ earlier today, I promised to make an estimate of daily hospitalizations during Delta and Omicron - information CDC should have provided. For stipulated Omicron periods from 6 to 20, I plotted implied daily values for Delta and Omicron for Total Visits, HospCovid, HospNon, etc
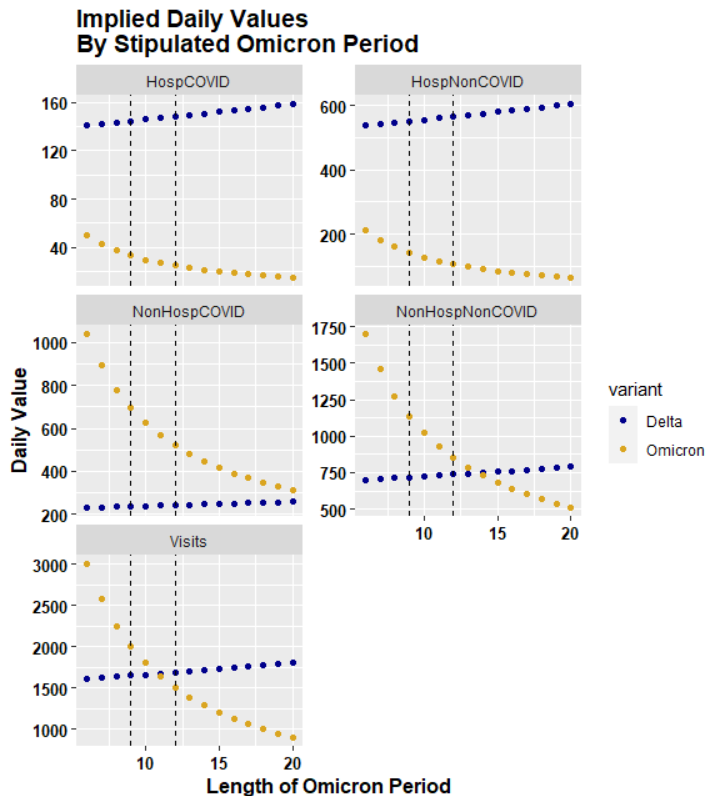
25/ from prior knowledge, we would expect Omicron period to begin in mid- to late- Dec. Thus, choice of k range.
For all such k values, daily COVID hospitalizations in Omicron are ~25% of corresponding rate in Delta. This also applied to daily non-COVID respiratory hosps.
For all such k values, daily COVID hospitalizations in Omicron are ~25% of corresponding rate in Delta. This also applied to daily non-COVID respiratory hosps.
26/ jump down to last panel - daily Visits. k<11 implies more visits during Omicron than Delta; k >11 implies more visits during Delta than Omicron. Based on (much) higher daily hosp rates in Delta, it seems unlikely to me that daily visits would be lower in Delta. (Fig revised)

27/ Omicron length (k) under 20 days (especially under 15 days) imply much higher daily (3-4 x) rates of COVID visits WITHOUT hospitalization in Omicron than in Delta. This is consistent with reduced severity.
28/ a CDC Omicron period of 11-14 days also implies slightly higher not-hospitalized for non-COVID cases in Omicron period, but in the same range.
29/ overall, I estimate that the "effective" Omicron period length contained in CDC data is about 11-14 days. And would be VERY surprised if I were more than 5 days wrong. It's crazy that they didn't report this.
30/ bottom line is that implied DAILY hospitalization rates for COVID and non-COVID respiratory visits are MUCH lower in Omicron period than Delta period for this CDC dataset
• • •
Missing some Tweet in this thread? You can try to
force a refresh