,
3 tweets,
7 min read
Read on Twitter
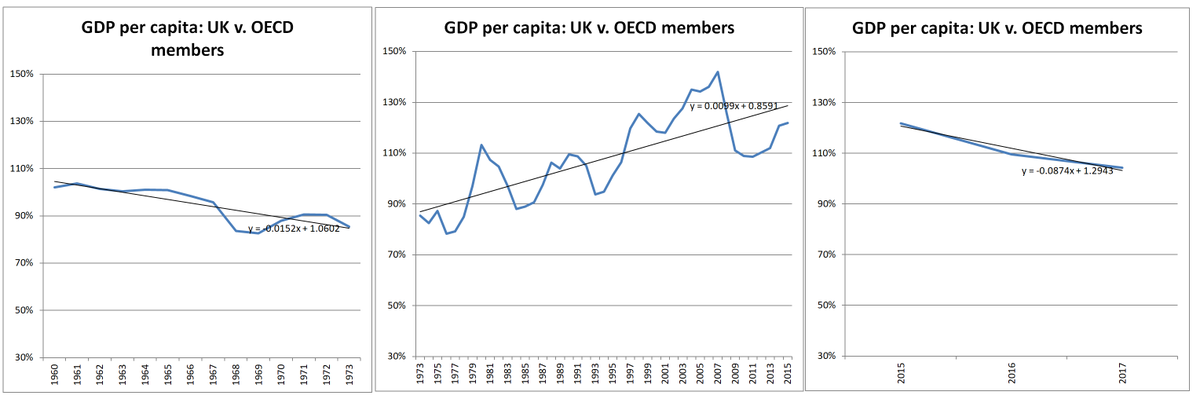
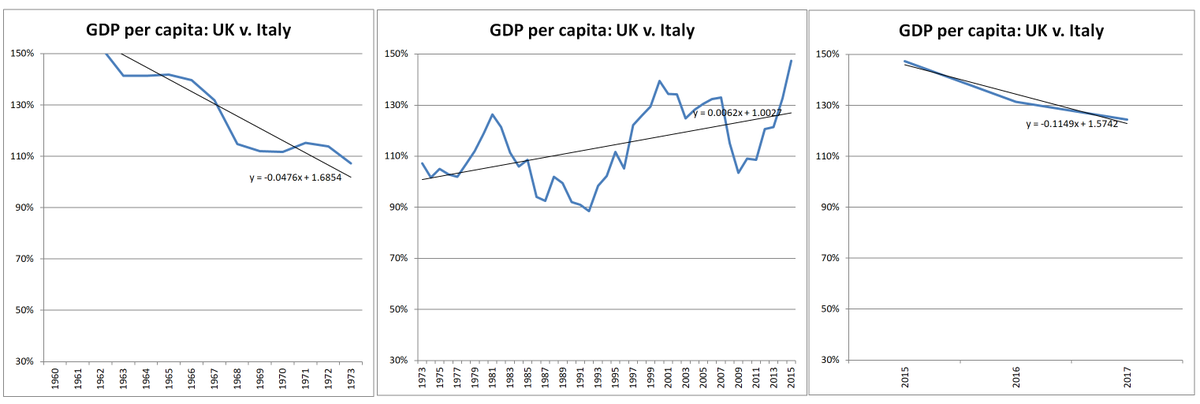
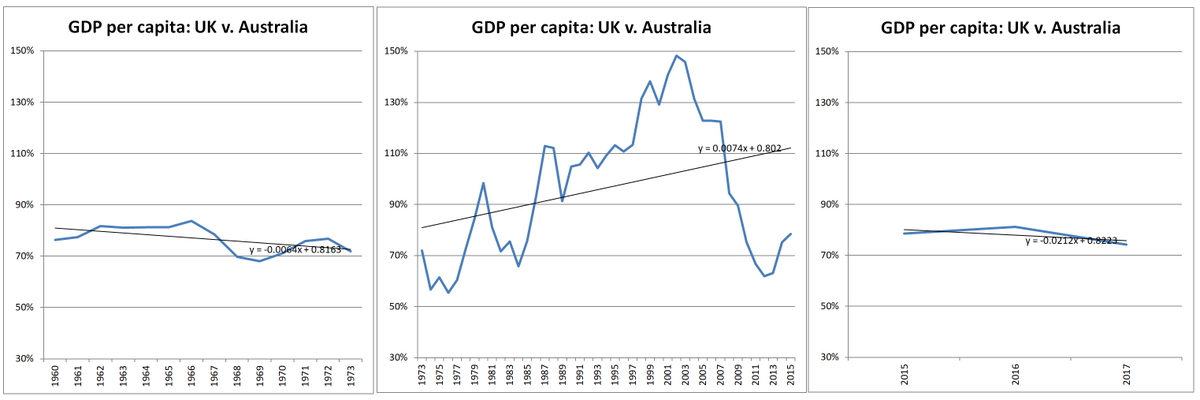
@Jim_Cornelius @WeeksKimD @soechristian @panmisthropist @olliedann @g_a_i_l_c @mikegalsworthy Had enough of this nonsense, so I went to World Bank source data: per capita GDP 1960-2017 api.worldbank.org/v2/en/indicato…
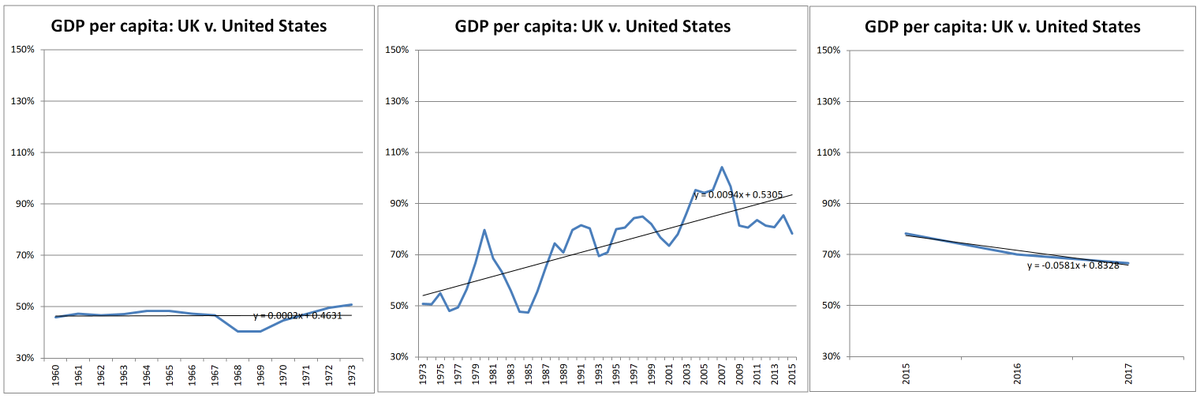
Plotted UK vs US for
'60-'73 "Pre-EU years"
'73-'15 "EU years"
'15-'17 "Pre-brexit years"
Excel adds the trendlines.
I dread the post-brexit trendline.
Plotted UK vs US for
'60-'73 "Pre-EU years"
'73-'15 "EU years"
'15-'17 "Pre-brexit years"
Excel adds the trendlines.
I dread the post-brexit trendline.
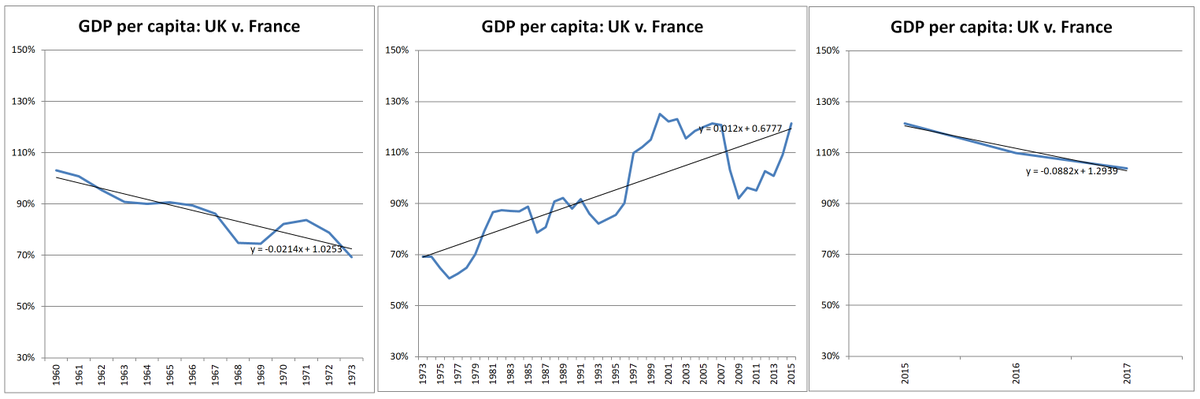
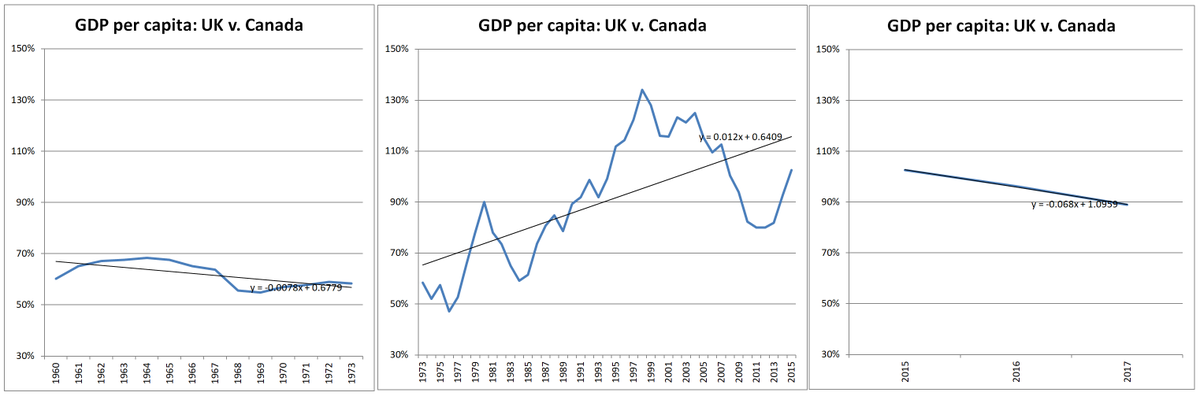
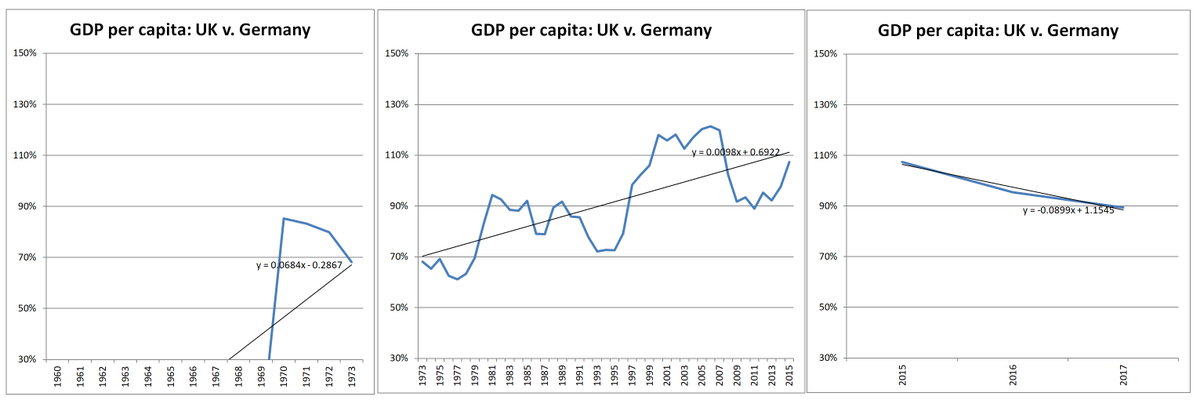
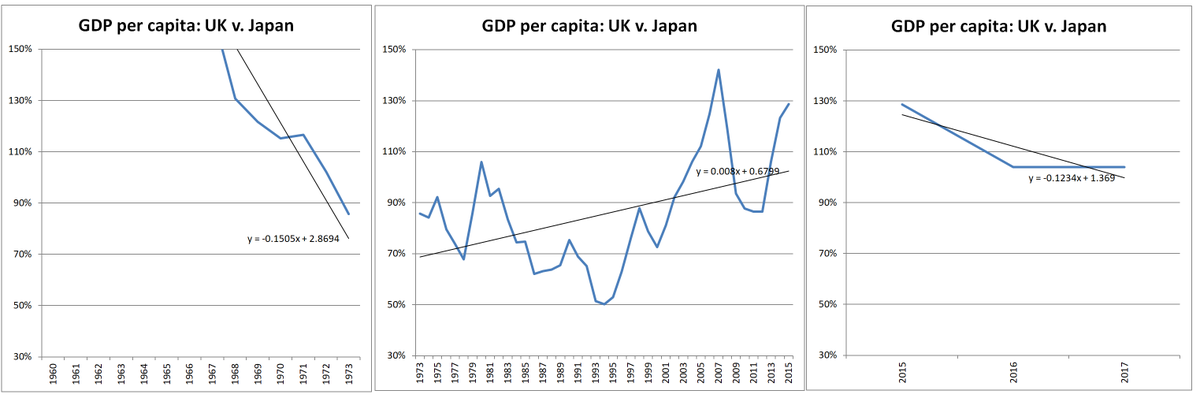
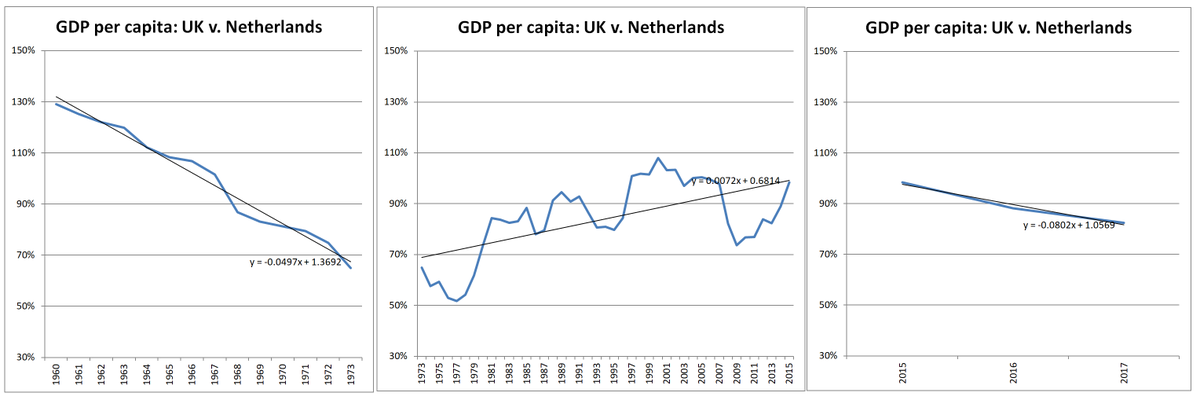
@Jim_Cornelius @WeeksKimD @soechristian @panmisthropist @olliedann @g_a_i_l_c @mikegalsworthy Some more....
(Germany's data starts 1969, but you get the picture....)
(Germany's data starts 1969, but you get the picture....)
@Jim_Cornelius @WeeksKimD @soechristian @panmisthropist @olliedann @g_a_i_l_c @mikegalsworthy Vs OECD members overall.