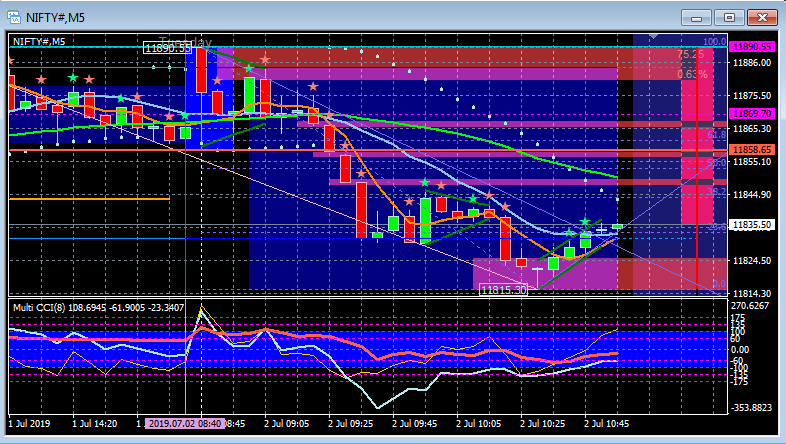
Nifty 5 min chart!
.
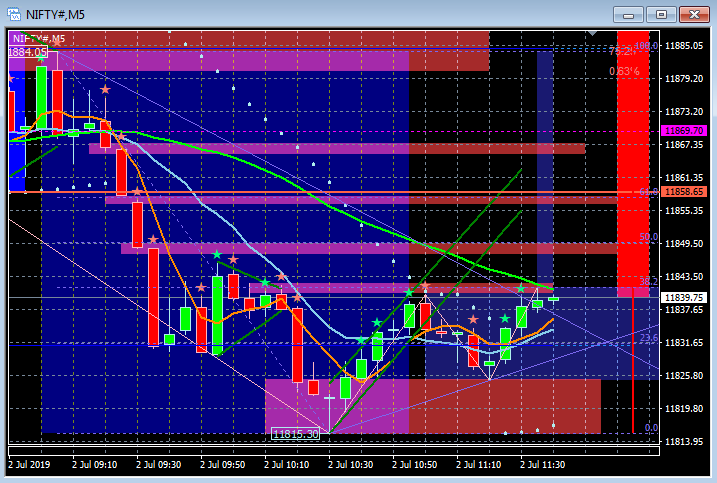
Pink horizontal lines are where they is resistance and obstruction to price flow. In between them free flow of price is possible.
.
Pink horizontal lines are where they is resistance and obstruction to price flow. In between them free flow of price is possible.

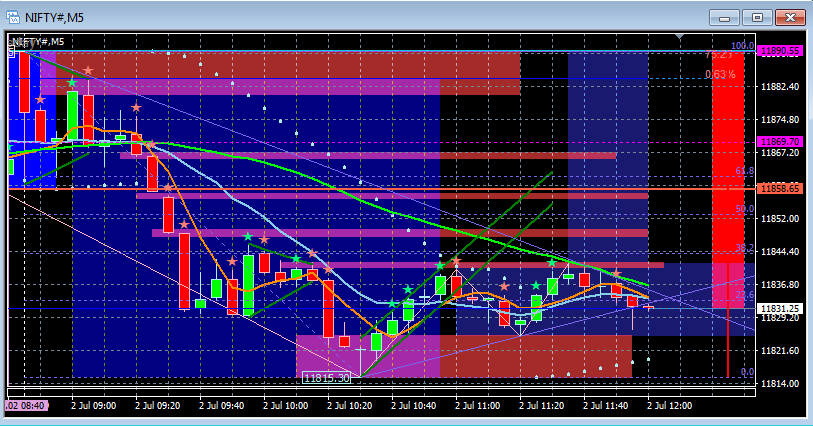
You will observe rotation between pink horizontal lines which are range due to bodies of indicisive candles ...
Nifty Spot 5min chart !
12;10
Nifty Spot 5min chart !
12;10

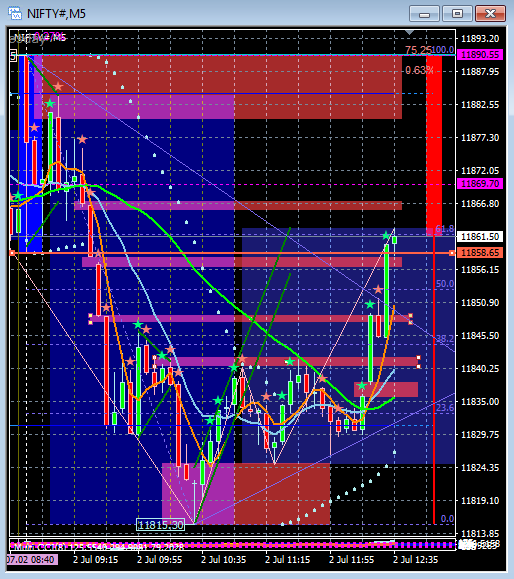
Strength Candle over Indecision Bank is barrier crossesed and we move to next higher resistances.
Nifty 5min chart 12:57
Nifty 5min chart 12:57

Nifty Update .. one more indecision barrier crossed with a placement of body of strength candle over it.
.
Just classification of candles in to two - Indecision & Momentum... Names of Candles don't matter .. is that a wake up call? .. doing it for years !
.
Just classification of candles in to two - Indecision & Momentum... Names of Candles don't matter .. is that a wake up call? .. doing it for years !

Nifty Spot 11869 … even a marginal higher high above 27Jun19 high of 11911 will change the structure of current wave to HH HL …. 13:15
• • •
Missing some Tweet in this thread? You can try to
force a refresh


