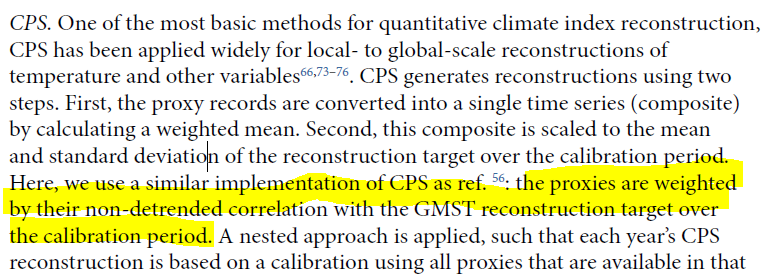
another sleight-of-hand in new PAGES2K paper. They say tht they use CPS (which had the advantage of using straightforward average of standardized series - no ex post sign change/flipping.) But in fine print, something different: their "CPS" weight proxies by correlation to target
2/ mathematically, this is identical to Partial Least Squares regression of the target onto the proxies. (Stone and Brooks have interesting analysis of path from these coefficients to OLS coefficients in coefficient space.)
3/ if, as in this example, there are 200+ proxy series and a calibration period of 100 years or so, you're going to get a pretty good fit through PLS regression. D'oh.
4/ I plotted the top 10 series with largest absolute value Hockey Stick out of the 257 in superscreened data. (Their "unscreened" set of 690 or so proxies had already been chosen by industrialized screening.) Most are familiar.
5/ Note that the #1 HS series (Cape Ghir) is an alkenone series denominated in Centigrade (not ring widths) and it goes down. Discussed several times at CA climateaudit.org/tag/mcgregor/
6/ PAGES doesnt give the values or even signs of coefficients in various reconstructions. In many, if not most, of the reconstructions, I suspect that the declining temperature Cape Ghir alkenone series will be flipped and be large contributor to reported large HS reconstruction
7/ the #2 HSI series (Arc-Larsen) is the Hvitarvatn, Iceland varve thickness, discussed on MANY occasions at CA climateaudit.org/tag/hvitarvatn/. It was used upside down in PAGES2013. I criticized them for this and they grudgingly corrected in 2014 Corrigendum.
8/ my guess is that it's upside down once again in at least some of the 2019 calculations. If they published resultant weights for each proxy, one could tell directly. Otherwise, it takes huge effort to fully replicate calculations.
9/ three of top 10 HS series are strip bark bristlecone chronologies, two of which (nv512, ca529) are Graybill versions used in MBH98 and nearly all subsequent studies, while one (GB) is update of a Graybill series.
10/ two chronologies from Yukon-Alaska by Jacoby-Darrigo, plus Mackenzie Delta by Porter. Jac-D'Arr series go up in first part of 20th century; "divergence problem" in late 20th. Porter also had divergence problem with his trees, but simply deleted 20th century portion of trees
11/ with divergence problem. I have some detailed notes on D'Arrigo's northern Canadian chronologies, which are a total mess. I'll try to write this up some time.
12/ another series (Martin-Chivelet) is a speleothem d18O series from northern Spain. I've got a lot of notes on speleothem d18O data- which I find very interesting and with interesting consistencies. None of the speleothem data shows anything unusual about modern d18O levels in
13/ a Holocene scale. This is quite interesting to show. I haven't noticed a late 20th century spike in other speleothem series, but will take a look at it some time.
14/ the ID for the other series Asia-SODAPS is not a traceable ID or reference. From its lat-long, it appears to be the Sol Dav, Mongolia Jacoby-Darrigo tree ring series that has been a mainstay of many canonical proxy reconstructions and nothing new.
15/ in 12 above, I observed that speleothem d18O series from Spain with late 20th century upspike didn't look like other of the many speleothem d18O series that I've seen. I doublechecked that PAGES 2017 said d18O and it did. However, series isnt d18O. It's d13C, which has
16/ here is data reference for series which shows that its d13C, which I checked. This is an important, not trivial, difference, as properties of proxy different. Mistake is the sort of error that people make when they are doing nothing more than mining for hockey sticks.
17/ here is summary of South American proxy counts from Neukom 2014 thru PAGES 2013, 2017 and 2019. Overall 93 unique proxies (tree -65). "Screened" to 21 in P13, 8 in P17 and 4 in P19. See 2018 discussion of South American proxies here: climateaudit.org/2018/10/07/pag…
18/ looking back at my article on PAGES 2017 South America, I observed that recent values declined in the two series extended in P17. Both series were deleted from PAGES 2019. #HideTheDecline
19/ in my commentary, I also observed that Laguna Chepical, a new series in PAGES 2017, had been impacted by a man-made dam at the exact time that sedimentation increased i.e. series invalid. Deleted from PAGES 2019.
20/ one constant in South American multiproxy has been Quelccaya, Peru ice d18O. Interestingly, d18O has also been measured over Holocene in nearby speleothem, high lake sediments and ice cores. See below (Quelccaya in red.)
21/ top is lake sediments, middle speleothem, bottom ice core. Nice consistency between depleted d18O in LGM, elevated in Holocene Optimum with modern values intermediate.
22/ none of the datasets indicate that proxy values are somehow escaping Milankowitch limits and ascending into the stratosphere. Values declined into Little Ice Age and recovered in warming 20th century.
23/ in recent tweet, I observed that PAGES 2019 selected 64 of ~947 (6.7%) unique North American tree ring records that had "passed" prior screening tests in Mann 1998, Mann 2008, PAGES 2013 or PAGES 2014. Would it be surprise if result were "significant" at 5% level?

• • •

Missing some Tweet in this thread? You can try to force a refresh
 

Keep Current with Stephen McIntyre

Stephen McIntyre Profile picture

Stay in touch and get notified when new unrolls are available from this author!

Read all threads

This Thread may be Removed Anytime!

PDF

Twitter may remove this content at anytime! Save it as PDF for later use!

Try unrolling a thread yourself!

how to unroll video
  1. Follow @ThreadReaderApp to mention us!

  2. From a Twitter thread mention us with a keyword "unroll"
@threadreaderapp unroll

Practice here first or read more on our help page!

More from @ClimateAudit

Feb 8
In today's thread, I'm going to excavate some fascinating data on Omicron vs Delta from a CDC article. On its face, it's a garden variety sermon on vaccination
cdc.gov/mmwr/volumes/7…, but it contains other interesting data that wasnt discussed by the authors.
2/ bear with some preliminaries so that the precise point is understood when I get to it. The underlying database is 222772 visits ("encounters") by adults to 383 US emergency depts and urgent care clinics and 87904 hospitalizations at 259 hospitals from Aug 26/21 to Jan 5/22.
3/ Delta variant was predominant for most of period; Omicron rapidly became dominant in Dec and, by Jan, Omicron (rather than vaccination) had more or less eliminated Delta. While authors stratify results by "Delta" and "Omicron" periods, unfortunately they didnt quantify lengths
Read 30 tweets
Jan 24
UK has published some relatively detailed data showing "unadjusted" rates of case infection of boosted vs unvax by age group.
assets.publishing.service.gov.uk/government/upl… As context, Ontario SciTable only shows "adjusted" case rate purporting to show unvax rate as twice that of vax (2 or more doses)
2/ in ALL UK ages above 30, "unadjusted" case infection rate for triple-vax was HIGHER than among unvax. These results troubled UK authorities who printed unadjusted unvax rates in light gray, warning "comparing case rates ...should not be used to estimate vaccine effectiveness"
3/ the UK conclusion that "comparing case rates among vaccinated and unvaccinated populations should not be used to estimate vaccine effectiveness against infection" will come as news to Ontario SciTable and other authorities which regularly use such data in briefings
Read 14 tweets
Jan 16
Quebec, in midst of draconian lockdown, (unlike Ontario) publishes new hospitalization data by age group, vax status msss.gouv.qc.ca/professionnels…

These are real counts, neither "normalized" relative to population nor "adjusted" by Ontario Science Table (or CDC). What do you notice? Image
2/ the most obvious observation about new hospitalizations is that (unsurprisingly) they are dominated by seniors and particularly over 80s - a group which is almost totally vaxxed.
3/ a secondary observation is that, in younger agegroups, number of new hospitalizations among unvax is pretty similar to number of new hospitalizations among vax, even though population of unvax is much smaller. This is consistent with primary messaging from governments.
Read 17 tweets
Jan 12
in response to recent threads in which I showed actual vax and unvax case counts (not just per million), I've been abused by many commenters for my supposed failure to understand "data science 101" - that ONLY per million matters and only a moron would look at counts.
2/ I suspect that most of the abusive commenters are much younger than me and thus fail to consider why actual counts of fully-vax cases are of particular concern to someone who is fully vax and in a vulnerable age group (like me.)
3/ Nearly every 80+ and 70+ in Ontario was fully vax in Dec; yet there was unprecedented explosion of cases among seniors in mid-Dec. This is NOT due to almost non-existent unvax seniors. I wish it were. Yes, the few unvax are at more risk. But they arent causing senior caseload
Read 15 tweets
Jan 11
the actual operating problem for Ontario govt - what puts pressure on hospitals and ICUs - is most likely the dramatic resurgence of cases among Ontario seniors, even including 99.99% fully-vax 80+s.
2/ it is well known that hospitalization and ICU rates for senior COVID cases are FAR higher than younger cohorts. In Toronto, where fine-grained data is available, 34% of cases among 80-90s are hospitalized; 25% of cases among 70-79s hospitalized, 5.8% into ICU
3/ in November, the priority of federal government and Science Table appears to have been vaccinating 5-11 year olds, as opposed to boosting seniors. "Younger" seniors (60s and 70s) mostly wer not eligible for boosters until December due to 6-month federal regulation.
Read 4 tweets
Jan 10
today's Ontario cases are down almost 50% from Jan 1 max. Fully-vax cases accounted for ~85% of all cases; on a per million basis, fully vax cases still are higher than unvax cases. SciTable shows increasing cases, with "adjusted" unvax cases exceeding vax cases on per MM basis.
2/ here is today's NON-ICU hospitalizations, absolute and per million, by status. About 75% of non-ICU hospitalizations are full vax, flipping ratio that applied earlier in pandemic. Relative unvax rates remain higher.
3/ to estimate "excess" unvax non-ICU occupancy, I calculated what non-ICU numbers for unvax "should have been" if they had same relative occupancy as full-vax. It was ~100 extra for most of 2021, now ~150. This is 8% of present 1925 non-ICU occupancy.
Read 15 tweets

Did Thread Reader help you today?

Support us! We are indie developers!


This site is made by just two indie developers on a laptop doing marketing, support and development! Read more about the story.

Become a Premium Member ($3/month or $30/year) and get exclusive features!

Become Premium

Don't want to be a Premium member but still want to support us?

Make a small donation by buying us coffee ($5) or help with server cost ($10)

Donate via Paypal

Or Donate anonymously using crypto!

Ethereum

0xfe58350B80634f60Fa6Dc149a72b4DFbc17D341E copy

Bitcoin

3ATGMxNzCUFzxpMCHL5sWSt4DVtS8UqXpi copy

Thank you for your support!

Follow Us on Twitter!

:(