There is much talk about the so-called “Big Six” pulling away from the rest of the Premier League financially, but is this actually true? This thread looks at this question from the perspective of revenue, wages and total player costs #AFC #CFC #LFC #MCFC #MUFC #THFC
For the purpose of this analysis, we will take the 7th highest club in terms of revenue and wages for each season between 2010 and 2018. This means that the 7th placed club is not always the same. For example, for the last 4 seasons’ revenue this was #EFC, #LCFC, #WHUFC & #NUFC.
The highest revenue in the 2018 Premier League was #MUFC £590m, followed by #MCFC £503m, #LFC £455m, #CFC £448m, #AFC £389m, #THFC £379m and #EFC £189m. The highest growth since 2010 came at #MCFC with £378m (or 300%). 

The gap between the club with the 6th highest revenue (#THFC £379m) and 7th highest (#EFC £189m) shot up to £190m in 2018, compared to £73m in 2017 (though this would have been higher without #LCFC £70m Champions League money). Back in 2010 the gap was only £29m.

One reason for the growing gap between 6th and 7th highest revenue clubs is investment in new stadia, which has increased match day revenue at #THFC from £37m to £76m, while this has actually fallen at the 7th placed club from £24m to £16m. Thus gap has grown from £12m to £59m.

The equitable Premier League TV deal means there has been relatively little change in the gap between 6th and 7th highest revenue clubs, though even here this has grown by £17m since 2010. From 2019/20 the new distribution model for overseas deals will further increase the gap.

In contrast, the gap between 6th and 7th highest revenue clubs for European TV money (Champions League and Europa League) has risen by £42m since 2010. In particular, #THFC European revenue rose from £5m to £54m in last 3 years. New UEFA deals are likely to accelerate this trend.

The good news for the 7th placed club is that commercial income has doubled from £14m to £30m since 2010, but the bad news is that this revenue stream has more than tripled at the 6th placed club from £32m to £103m, which means the gap has widened from £17m to £73m in this period

In summary, the 2018 gap between the 6th and 7th highest revenue clubs in the Premier League of £190m comes from all revenue streams, led by commercial £73m and match day £59m. The £58m difference in broadcasting is dominated by European competitions £42m with only £17m domestic.

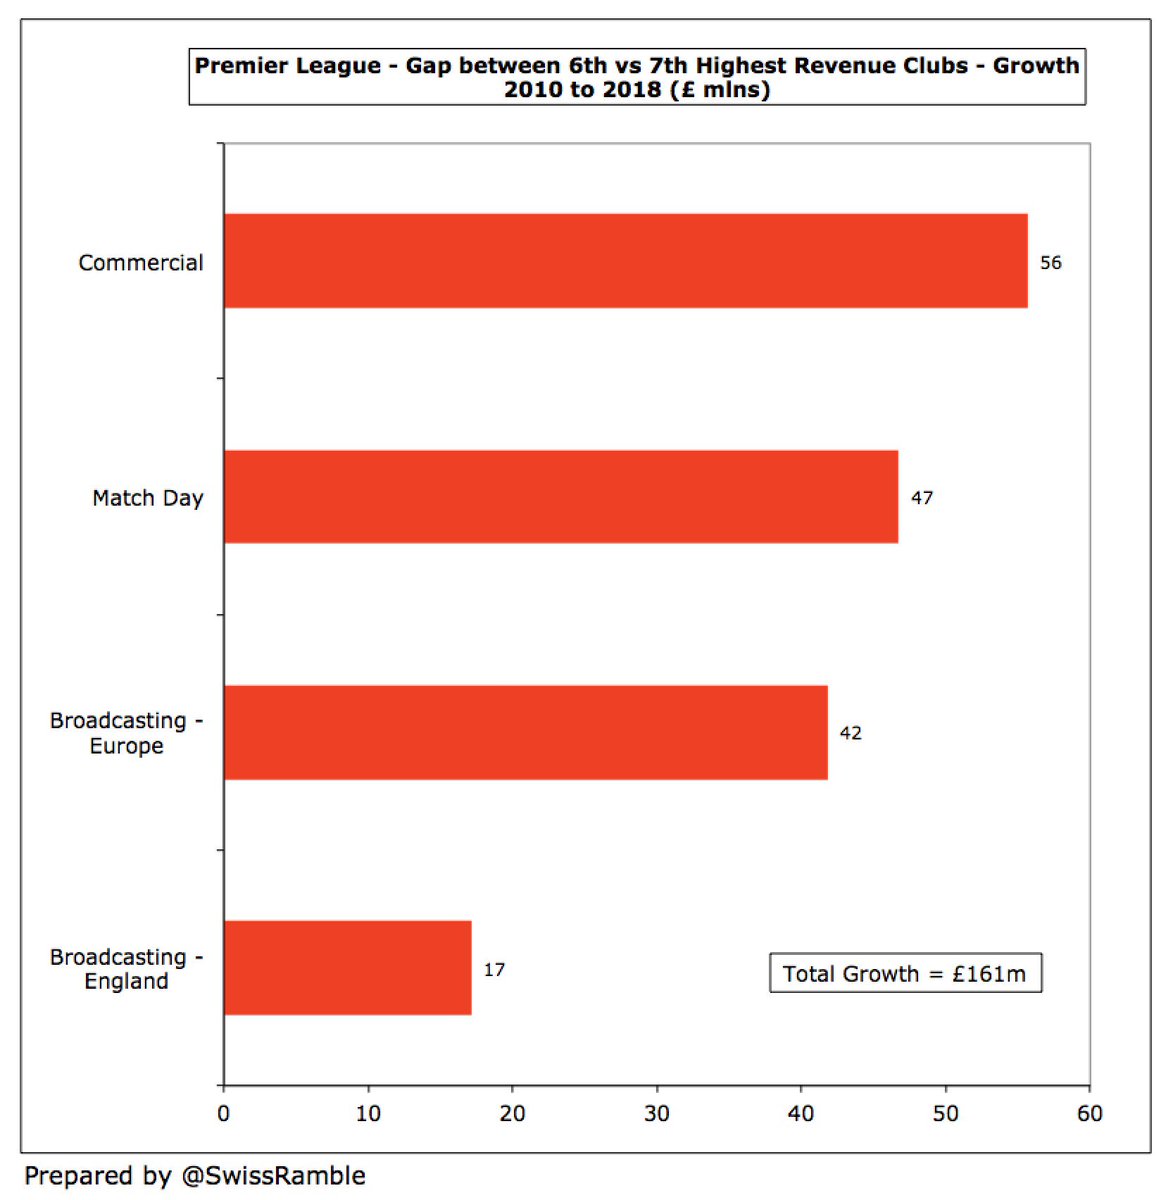
It’s a similar story in terms of the £161m growth in the gap between the 6th and 7th highest revenue clubs in the Premier League since 2010 of £161m (from £29m to £190m): commercial £56m, match day £47m, broadcasting Europe £42m and broadcasting England £17m.
The highest wage bill in the Premier League 2018 was #MUFC £296m, followed by #LFC £264m, #MCFC £260m, #CFC £244m, #AFC £223m, #THFC £148m and #EFC £145m. The highest growth since 2010 came at #MUFC with £164m (or 125%).

However, in contrast to revenue, the gap between the 6th and 7th highest wages clubs in the Premier League has actually fallen in the last 4 years to just £2m (#THFC £148m vs. #EFC £145m), partly due to Short Term Cost Controls (FFP), which restricted wages growth.

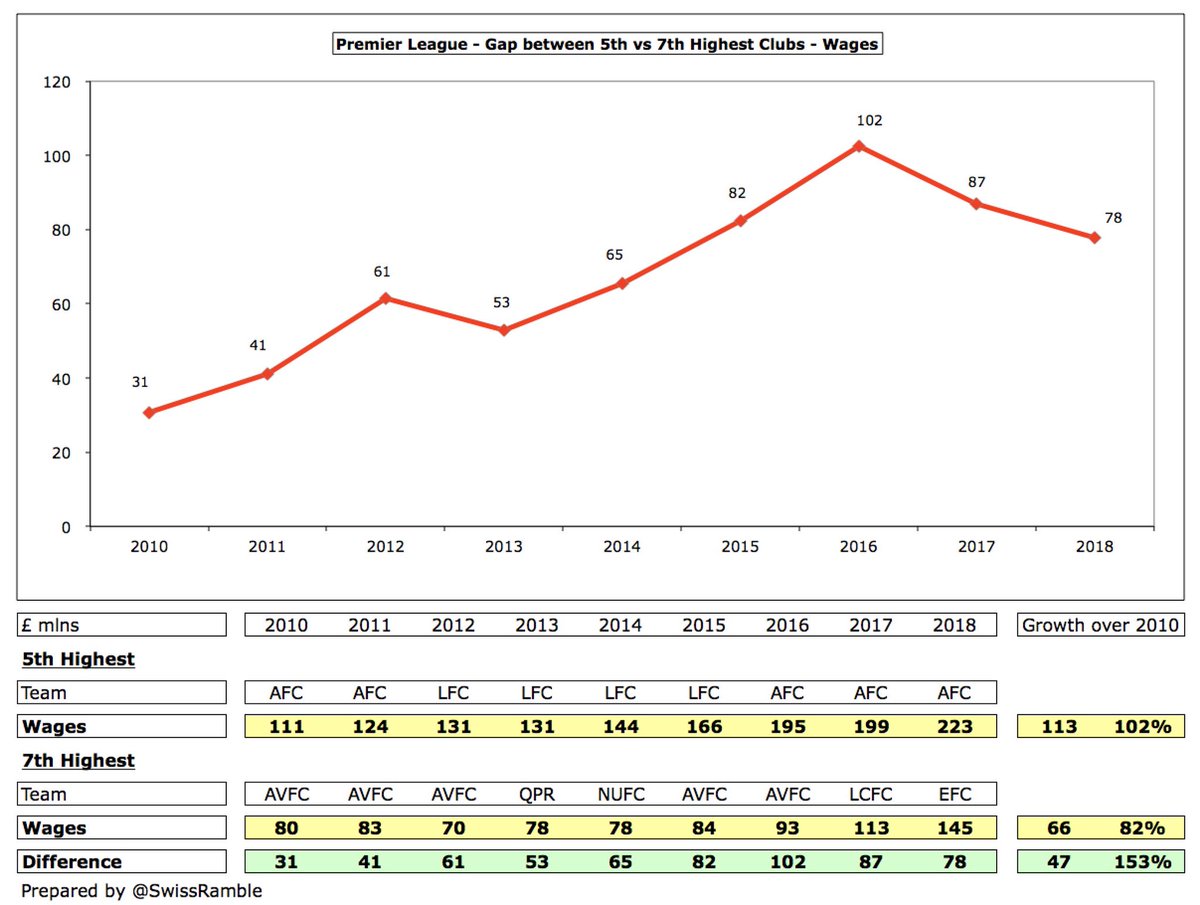
The small wages gap is also down to #THFC’s noted parsimony, so it’s worth also looking at the gap between the 5th and 7th placed clubs. Here, the gap increased from £31m to £78m since 2010, though it has narrowed in the last 2 years from a peak of £102m in 2016.
Using player amortisation as a proxy for transfer spend, it is interesting to note that this is much higher at #MUFC £138m, #MCFC £134m and #CFC £124m, compared to #AFC £86m, #LFC £77m and especially #THFC £58m. In fact, Spurs are actually lower than #EFC £67m.

Actually, player amortisation has often been higher at other clubs than the lowest in the Big Six over last few years, as mid-tier clubs invested in their squad in an attempt to break through the glass ceiling (#EFC and #WHUFC) or buy players to sell profitably later (#SaintsFC).

That said, it’s a bit different if we again take 6th placed #THFC out of the equation, though the gap is lower than might be expected at only £10m (down from £25m two years ago). This is essentially unchanged from the £9m gap in 2010.

Combining wages and player amortisation to obtain total annual player costs, the highest in the Premier League in 2018 was #MUFC £434m followed by #MCFC £394m, #CFC £368m, #LFC £341m, #AFC £309m, #EFC £212m and #THFC £205m.

Significant player acquisitions have taken #EFC above #THFC in wages and player amortisation, continuing a trend that has been closing the gap since the £42m peak difference in 2014.

Again, this is largely due to much lower expenditure at #THFC than the rest of the Big Six. If we instead look at the gap to the 5th highest club (generally #AFC or #LFC), this has steadily risen since 2010 from £25m to £97m (though it was higher at £136m in 2016).

To sum up, the revenue gap between the Big Six and the rest of the league continues to grow apace. While the story appear to be not quite so clear-cut in wages and transfer spend (player amortisation), it is much the same if we exclude low spending #THFC from the comparison.
• • •
Missing some Tweet in this thread? You can try to
force a refresh